 SQL Server
 Oracle
 MySQL
MySQL
 PostgreSQL
 Amazon Redshift
 Azure SQL Database
 DBT
DBT
 Google Big Query
 IBM DB2
 MariaDB
 SAP HANA
 Snowflake
 SQLite
 Teradata
 Vertica
Data observability tools for Amazon Dynamo DB
Data observability tools help the company track and understand the state of its data at any given time and provide it with full insight into their data pipelines. They also allow them to identify, monitor and troubleshoot errors in order to minimize data issues and improve high data quality.
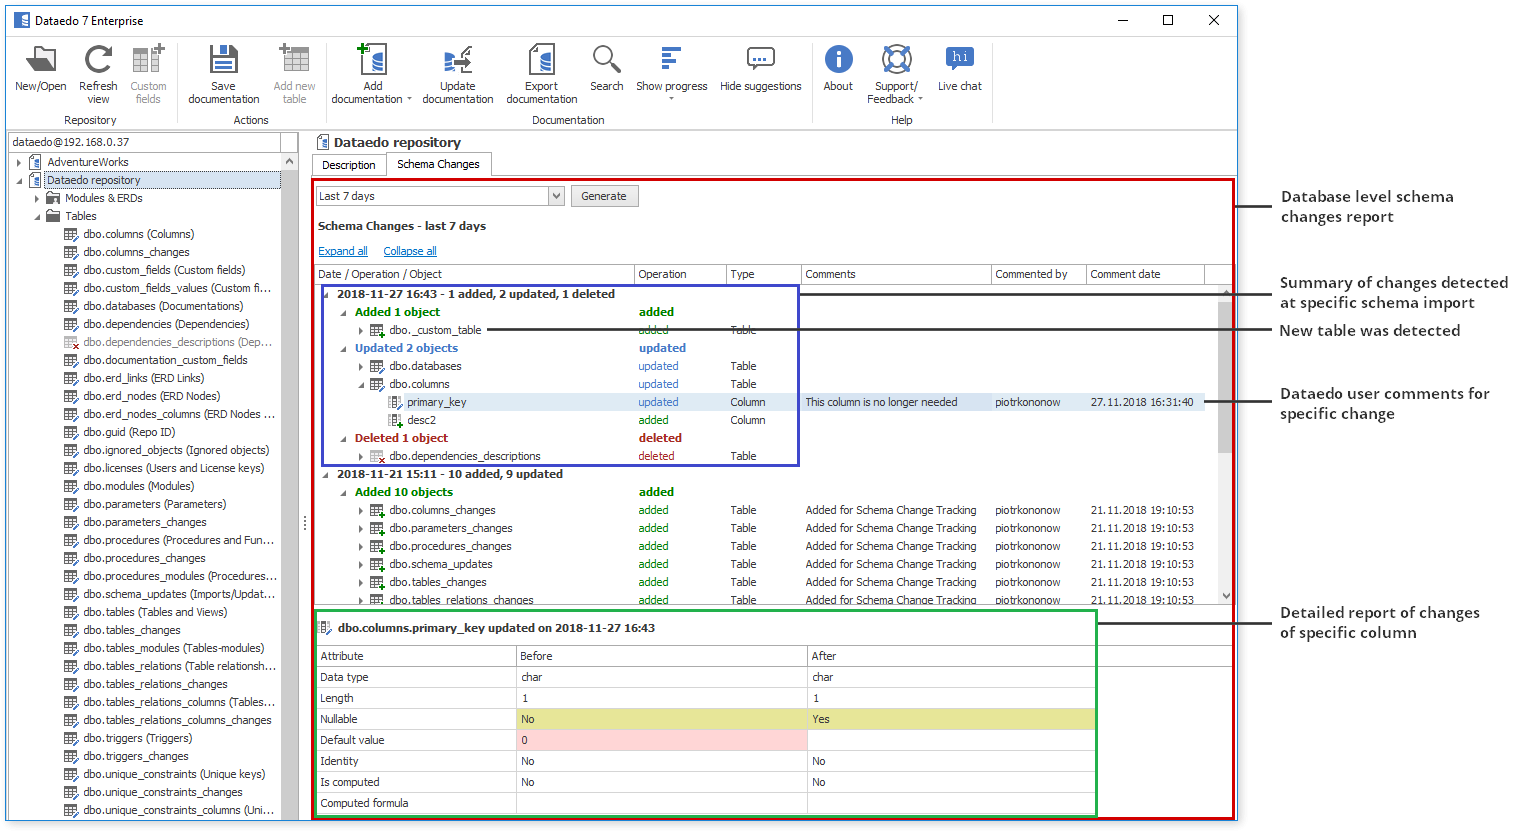
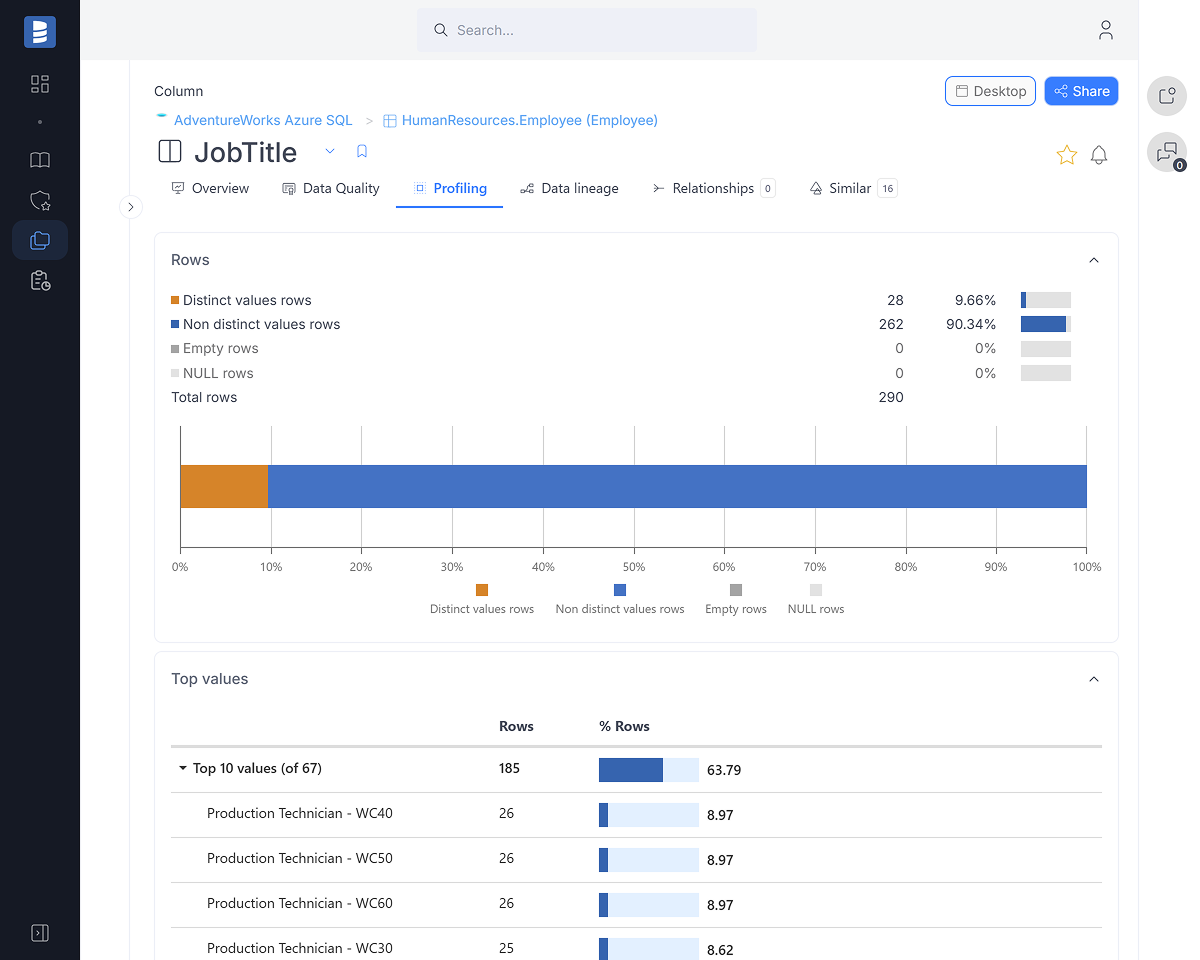
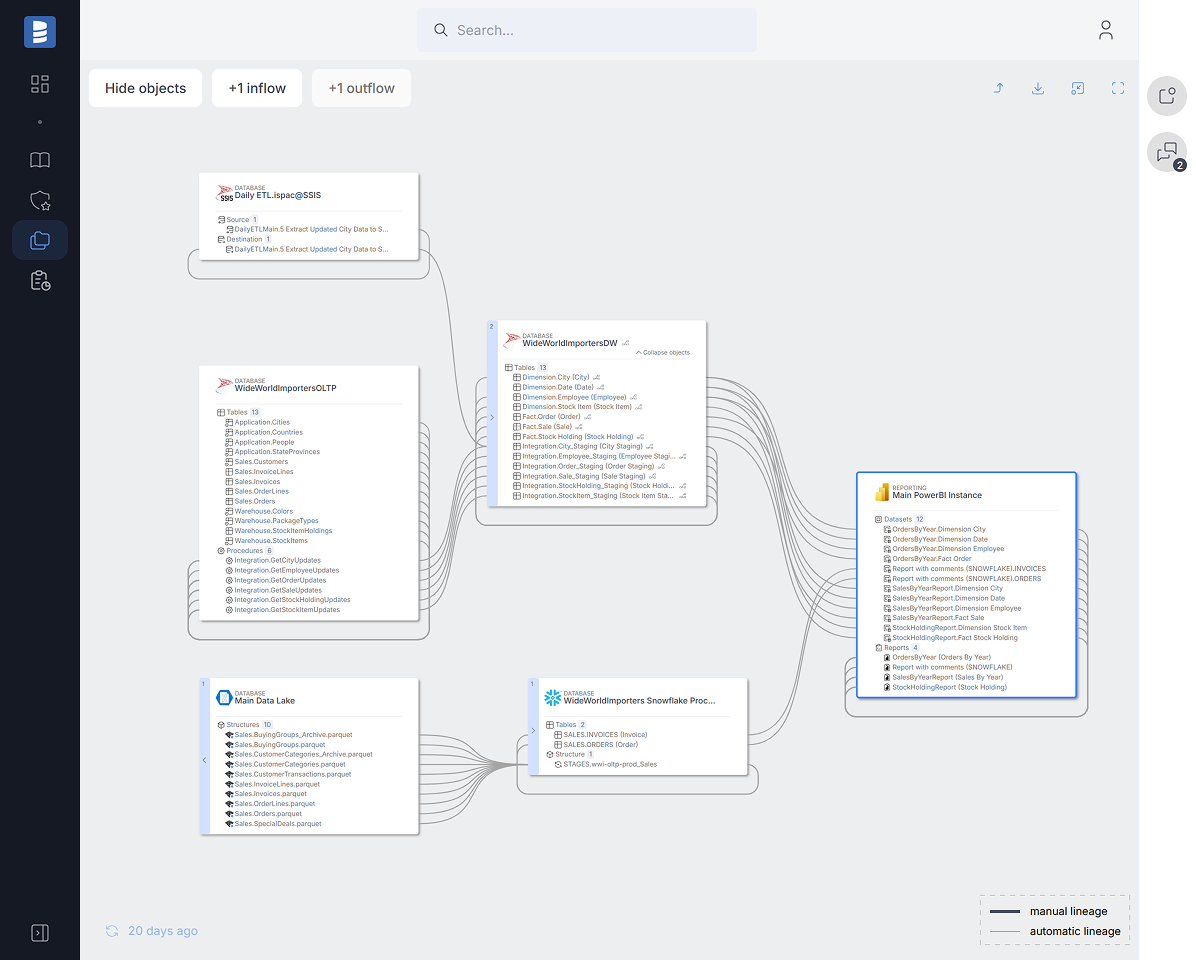
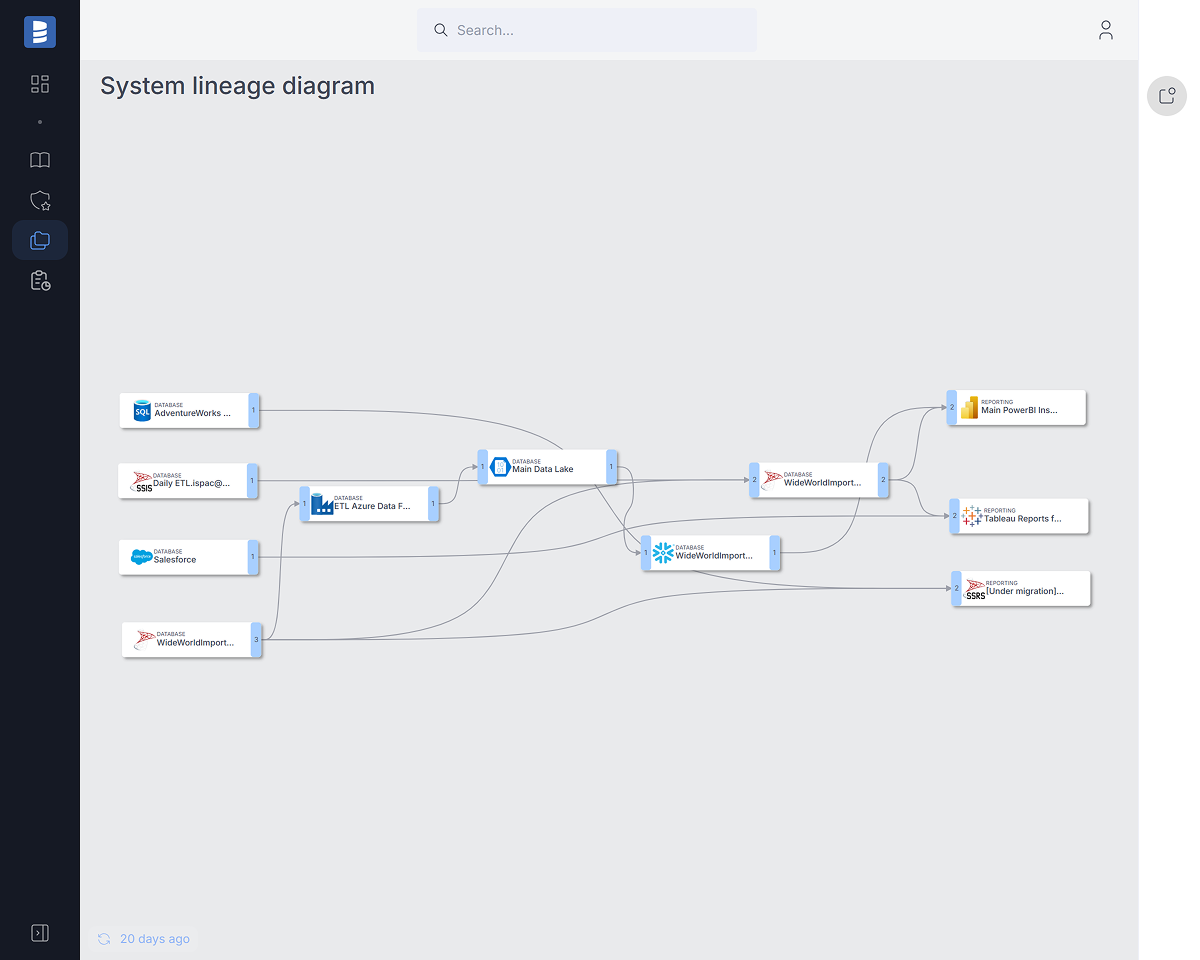
Dataedo
Dataedo is a data governance platform with data observability features such as data lineage, data profiling, and schema change tracking.
| Data Lineage: |
|
|---|---|
| Data Monitoring: |
|
| Data Profiling: |
|
| Export: | HTML,MS Excel,PDF |
| Free edition: |
|
| Machine Learning: |
|
| Notifications: |
|
| Schema Change Tracking: |
|
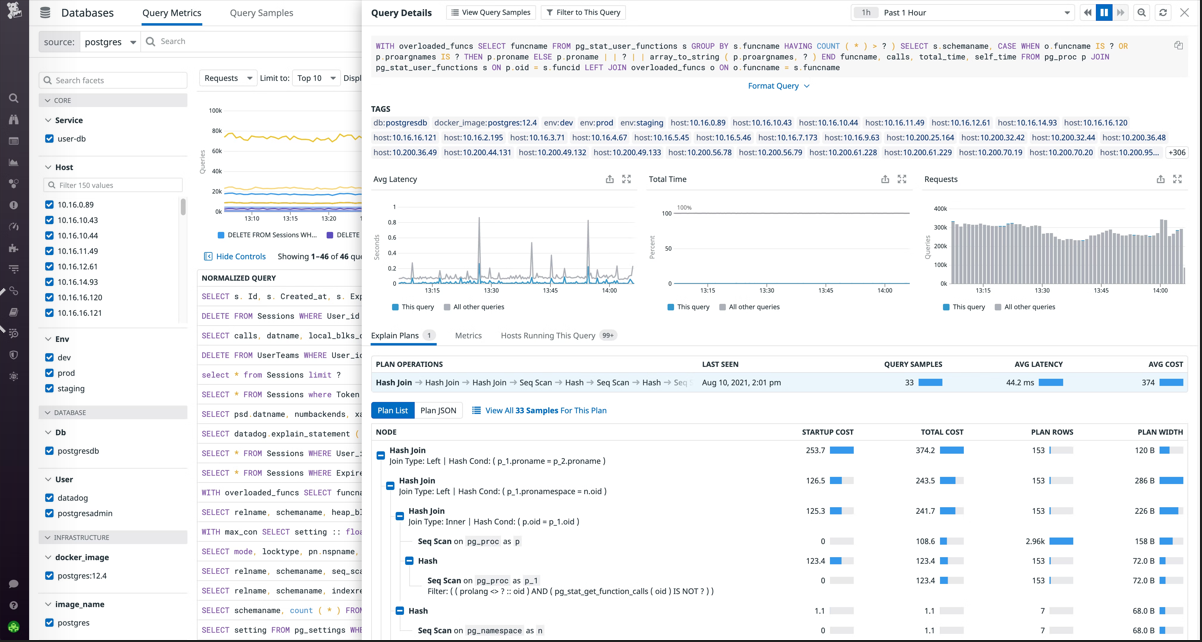
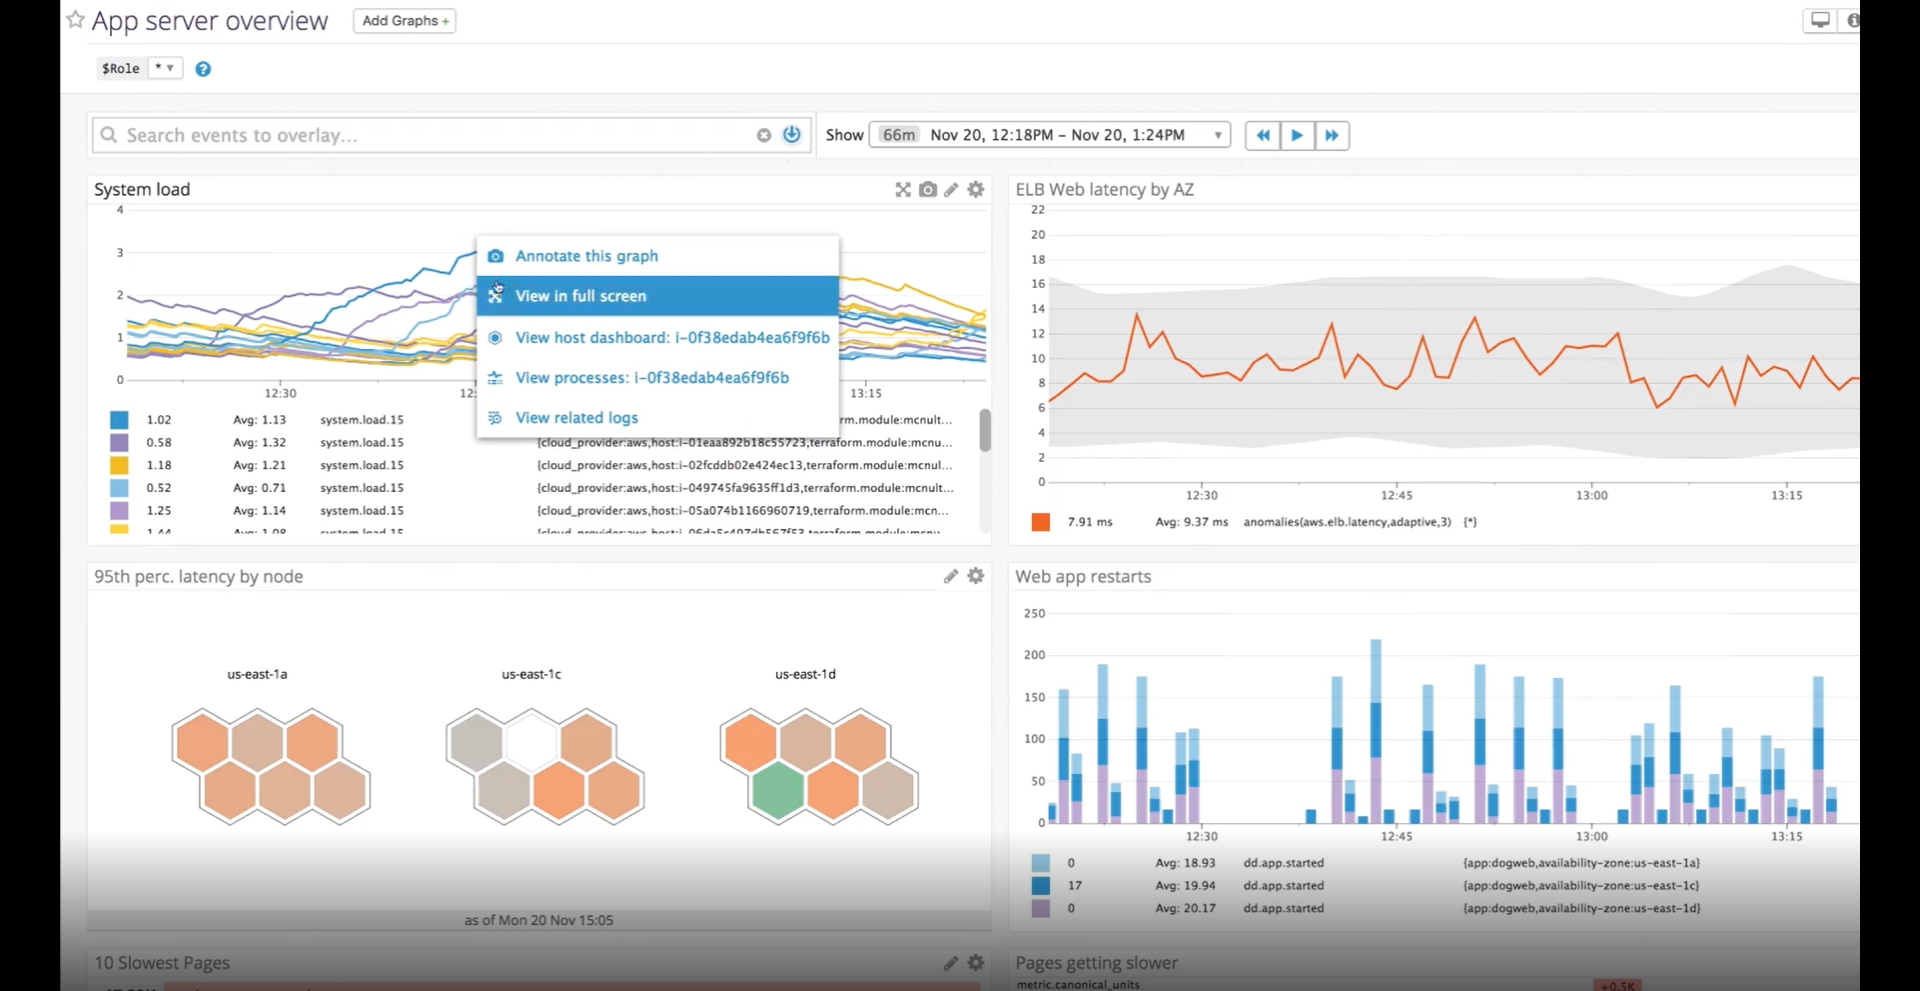
Datadog
Datadog is a unified observability platform that provides full visibility into the health and performance of each layer of your environment. It is an easy-to-navigate observability platform to explore and analyze your data, create and customize dashboards and other visualizations for data from across your systems, and leverage observability platform features like actionable alerts, threat detection rules, and the Datadog API. Overall, it brings together end-to-end traces, metrics, and logs to make your applications, infrastructure, and third-party services entirely observable.
| Data Lineage: |
|
|---|---|
| Data Monitoring: |
|
| Data Profiling: |
|
| Export: | CSV |
| Free edition: |
|
| Machine Learning: |
|
| Notifications: |
|
| Schema Change Tracking: |
|

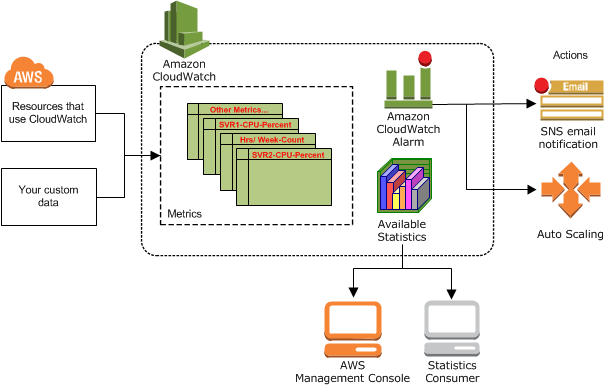
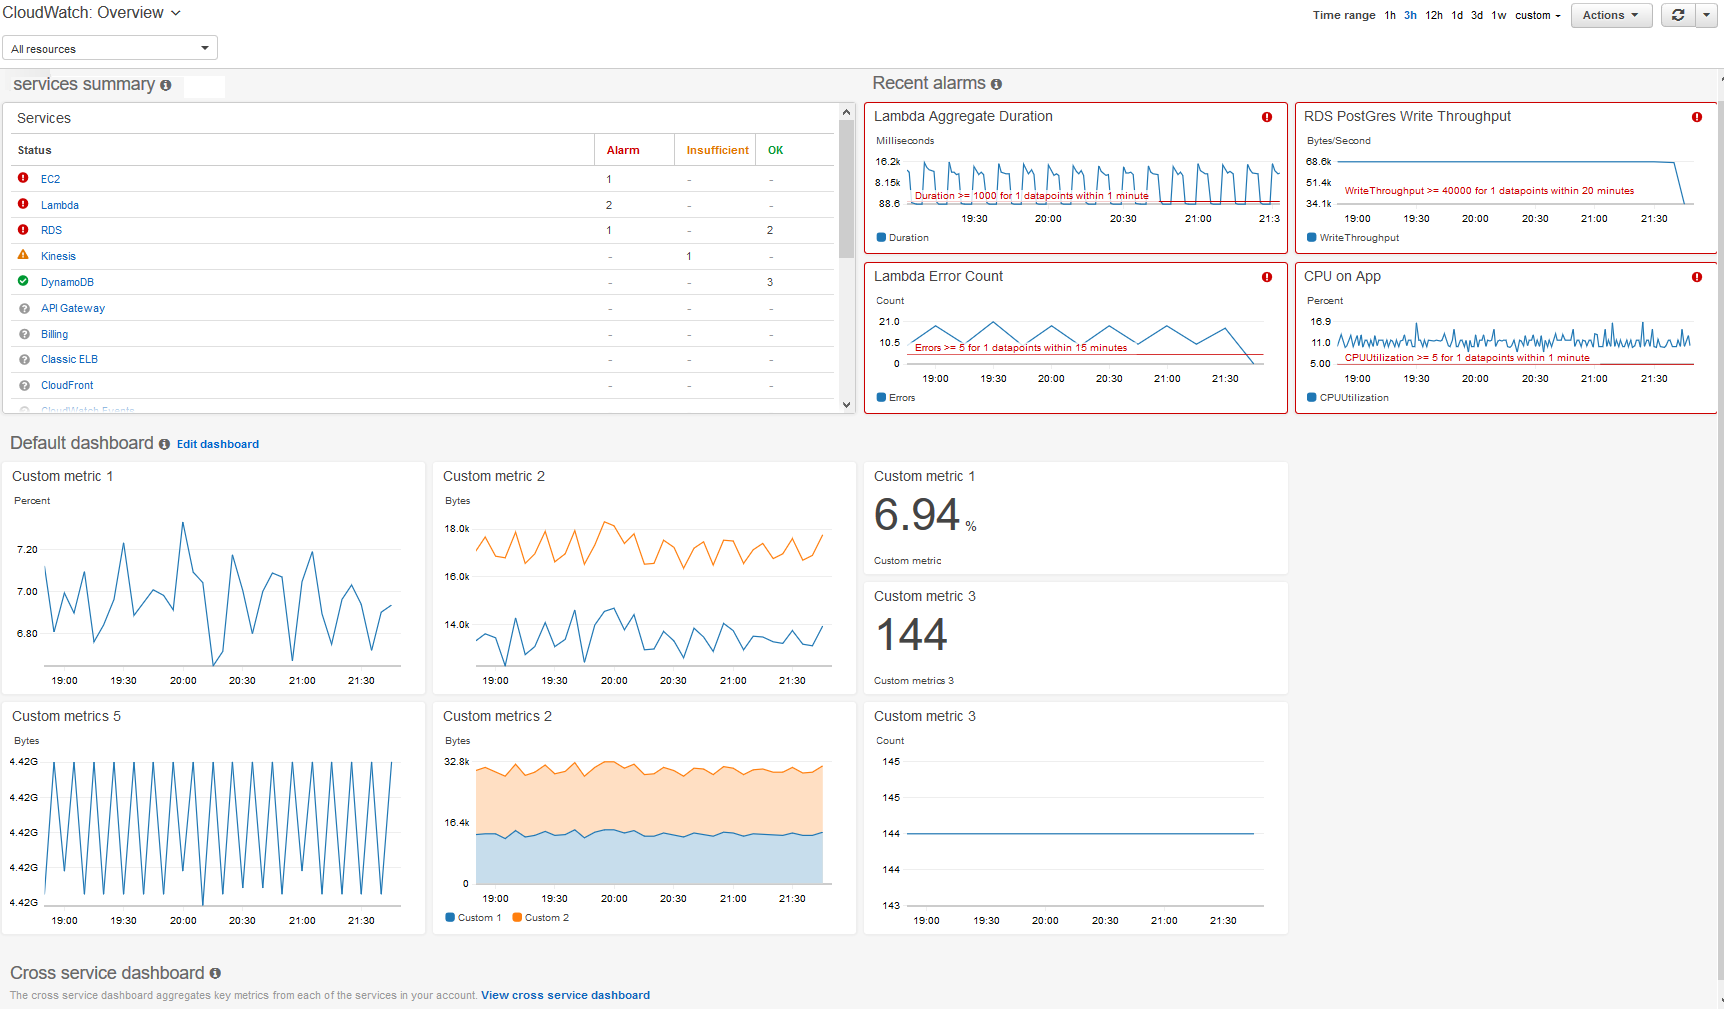
Amazon CloudWatch
Amazon CloudWatch is a monitoring and observability service built for DevOps engineers, developers, site reliability engineers, and IT managers. CloudWatch provides you with data and actionable insights to monitor your applications, respond to system-wide performance changes, optimize resource utilization, and get a unified view of operational health. Moreover, it collects monitoring and operational data as logs, metrics, and events, providing you with a unified view of AWS resources, applications, and services that run on AWS and on-premises servers.
| Data Lineage: |
|
|---|---|
| Data Monitoring: |
|
| Data Profiling: |
|
| Export: | CSV,MS Excel |
| Free edition: |
|
| Machine Learning: |
|
| Notifications: |
|
| Schema Change Tracking: |
|
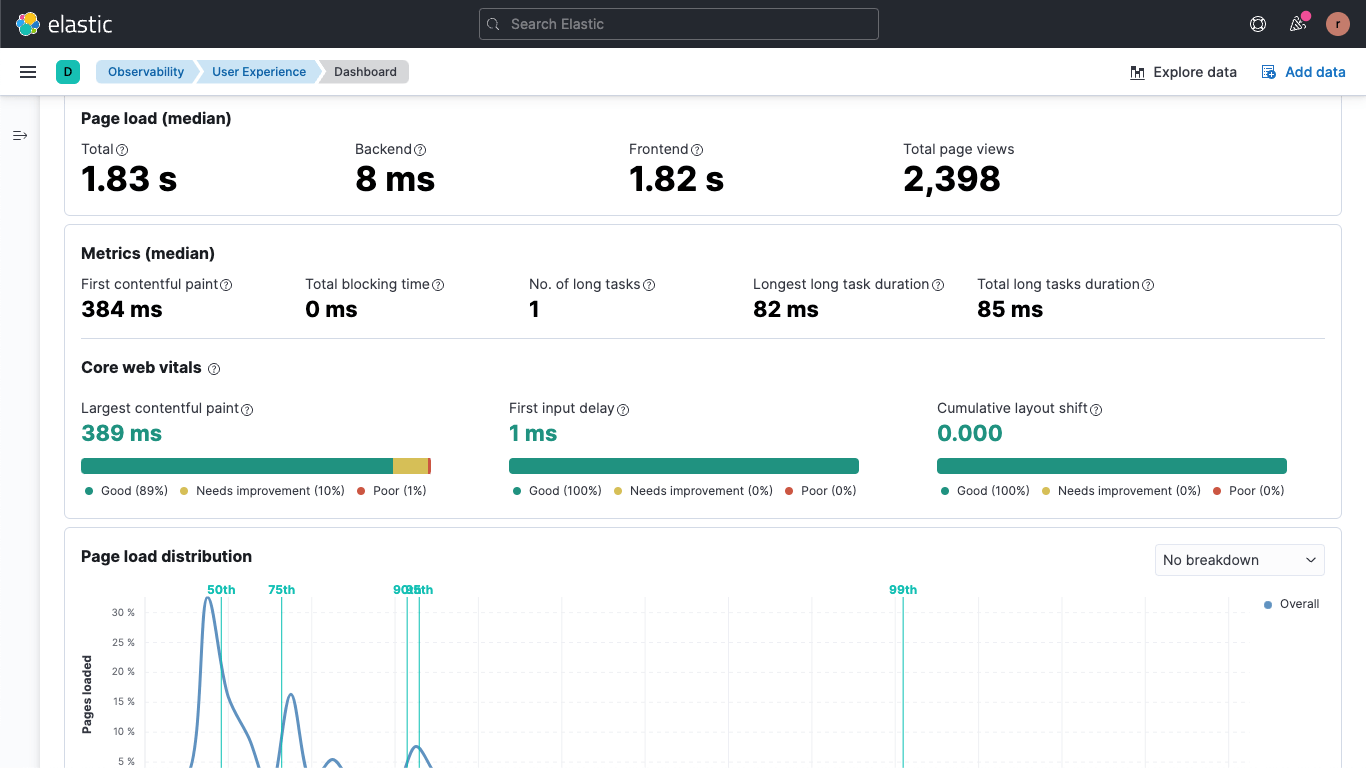
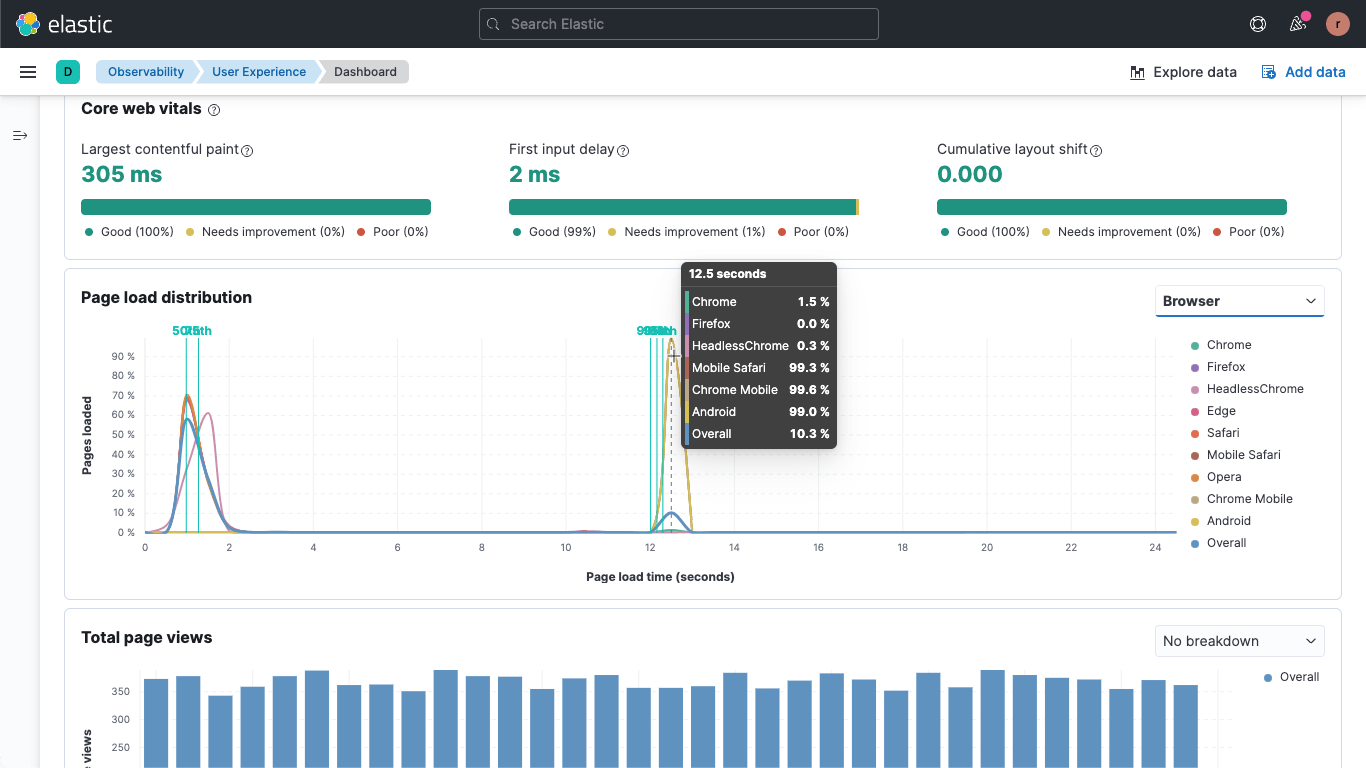
Elastic Observability
Elastic Observability transforms your data into actionable observability. It is built on the proven ELK Stack to converge metrics, logs, and traces, delivering unified visibility and actionable insights. With Elastic Observability, you can easily ingest metrics, logs, and traces quickly and easily from applications and infrastructure hosted in a data center or on cloud providers.
| Data Lineage: |
|
|---|---|
| Data Monitoring: |
|
| Data Profiling: |
|
| Export: | CSV,PDF |
| Free edition: |
|
| Machine Learning: |
|
| Notifications: |
|
| Schema Change Tracking: |
|

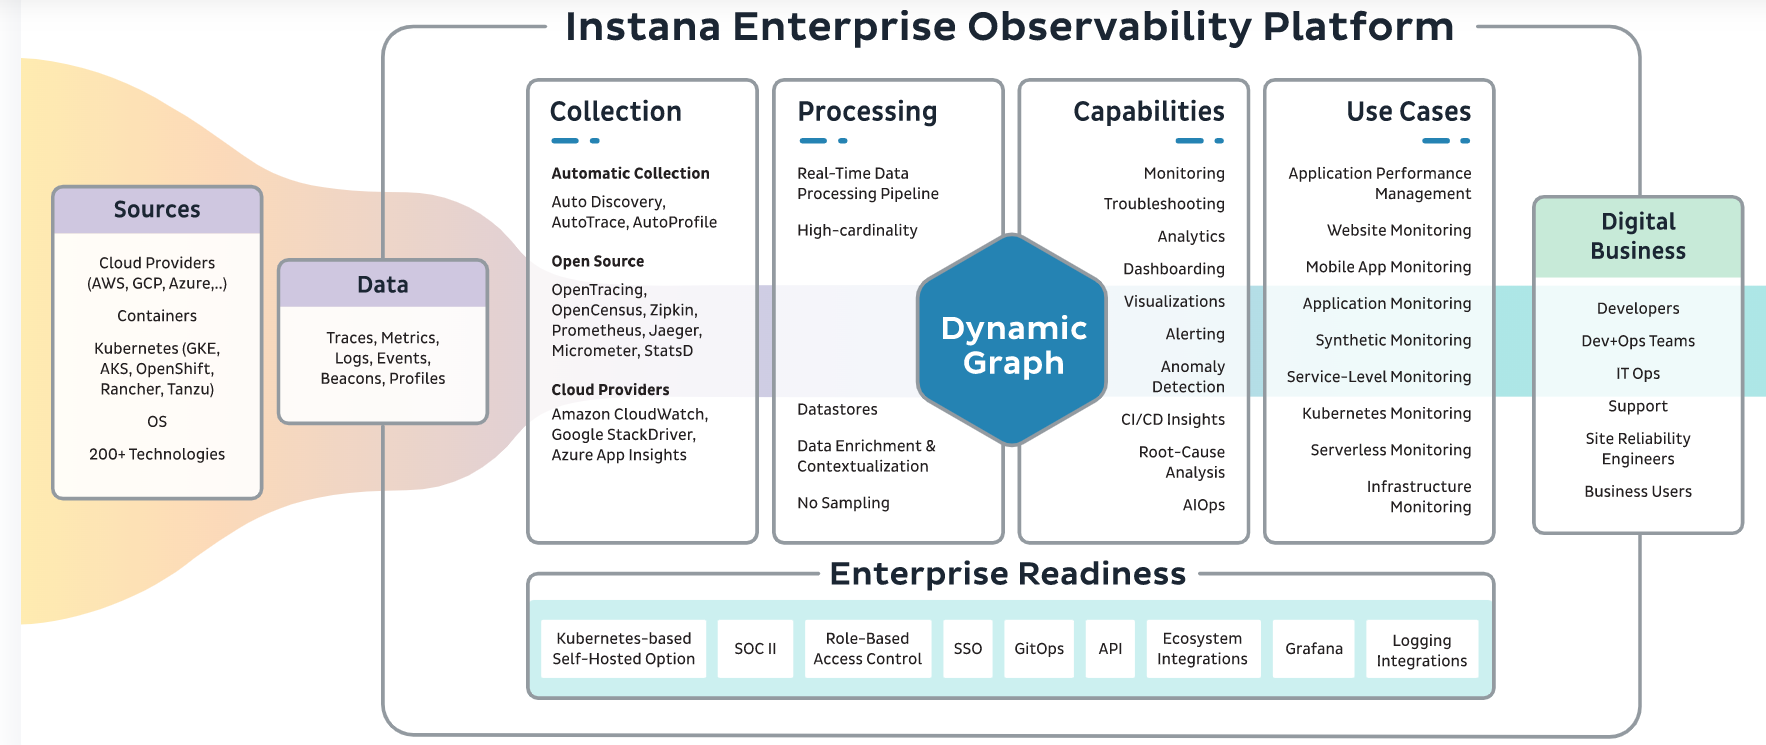
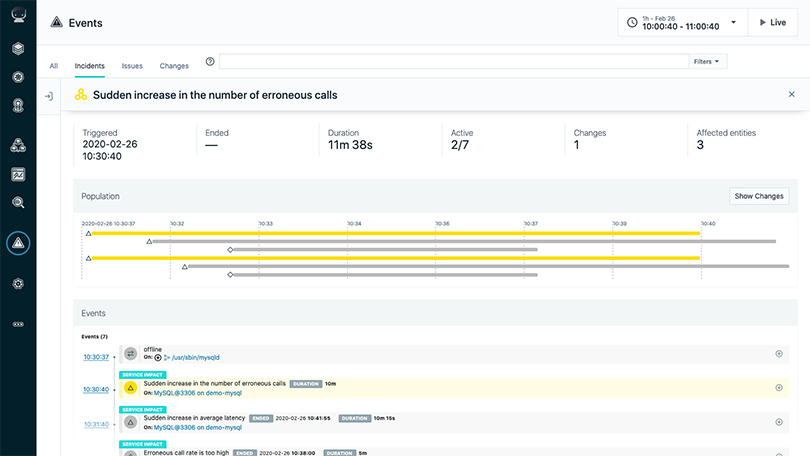
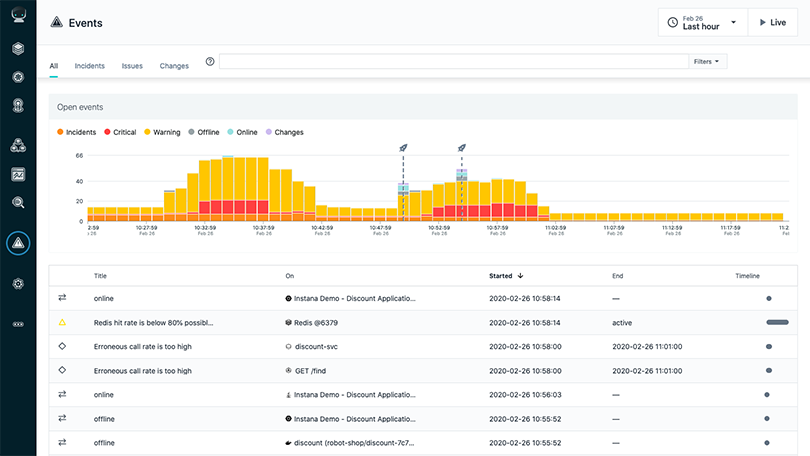
Instana
Instana's Enterprise Observability Platform ingests all performance metrics, traces all requests, and profiles every process, along with the capabilities needed to make observability work for the enterprise. Its automatic discovery, monitoring, root cause analysis, and feedback reduce the amount of stress when deploying new code or making changes to the system with immediate feedback on the performance and quality of your applications at each step of the software delivery pipeline.
| Data Lineage: |
|
|---|---|
| Data Monitoring: |
|
| Data Profiling: |
|
| Export: | - |
| Free edition: |
|
| Machine Learning: |
|
| Notifications: |
|
| Schema Change Tracking: |
|
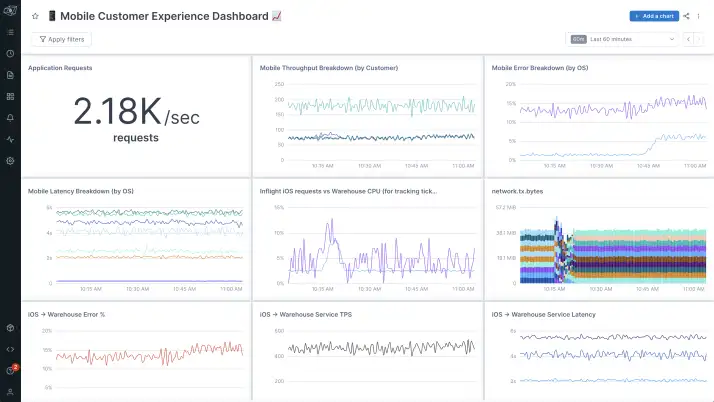
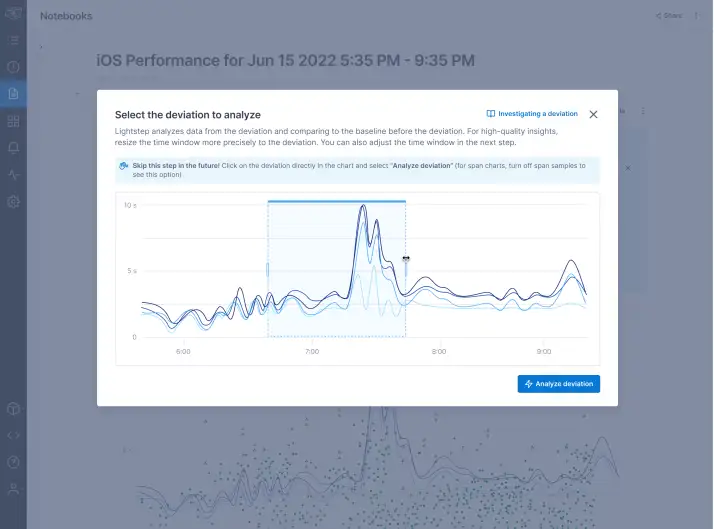
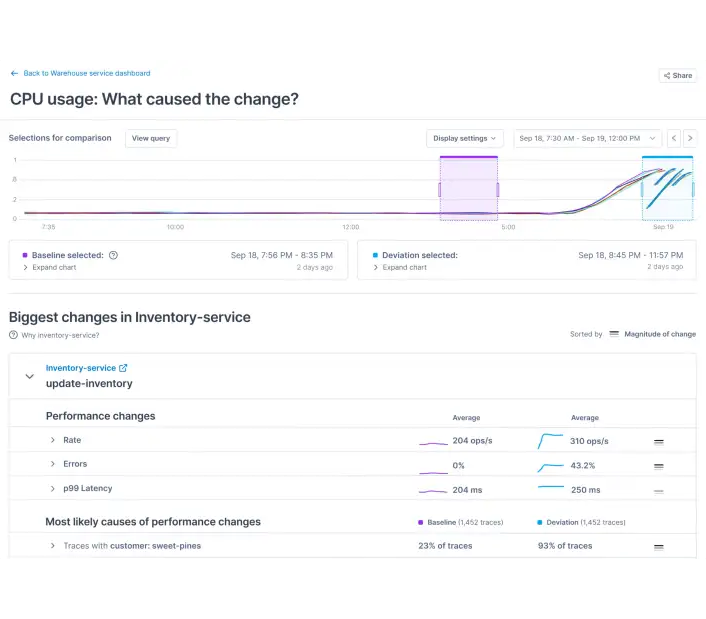
Lightstep
Lightstep is a complete, unified, and primary observability platform for the enterprise that provides complete system visibility and context at scale. It automatically detects changes to your application, infrastructure, and user experience — and surface the specific causes. Moreover, Understand and improve performance across millions of devices, users, and customers. Overall, visualize, aggregate, and analyze planet-scale application and infrastructure metrics at a fraction of the cost
| Data Lineage: |
|
|---|---|
| Data Monitoring: |
|
| Data Profiling: |
|
| Export: | CSV |
| Free edition: |
|
| Machine Learning: |
|
| Notifications: |
|
| Schema Change Tracking: |
|
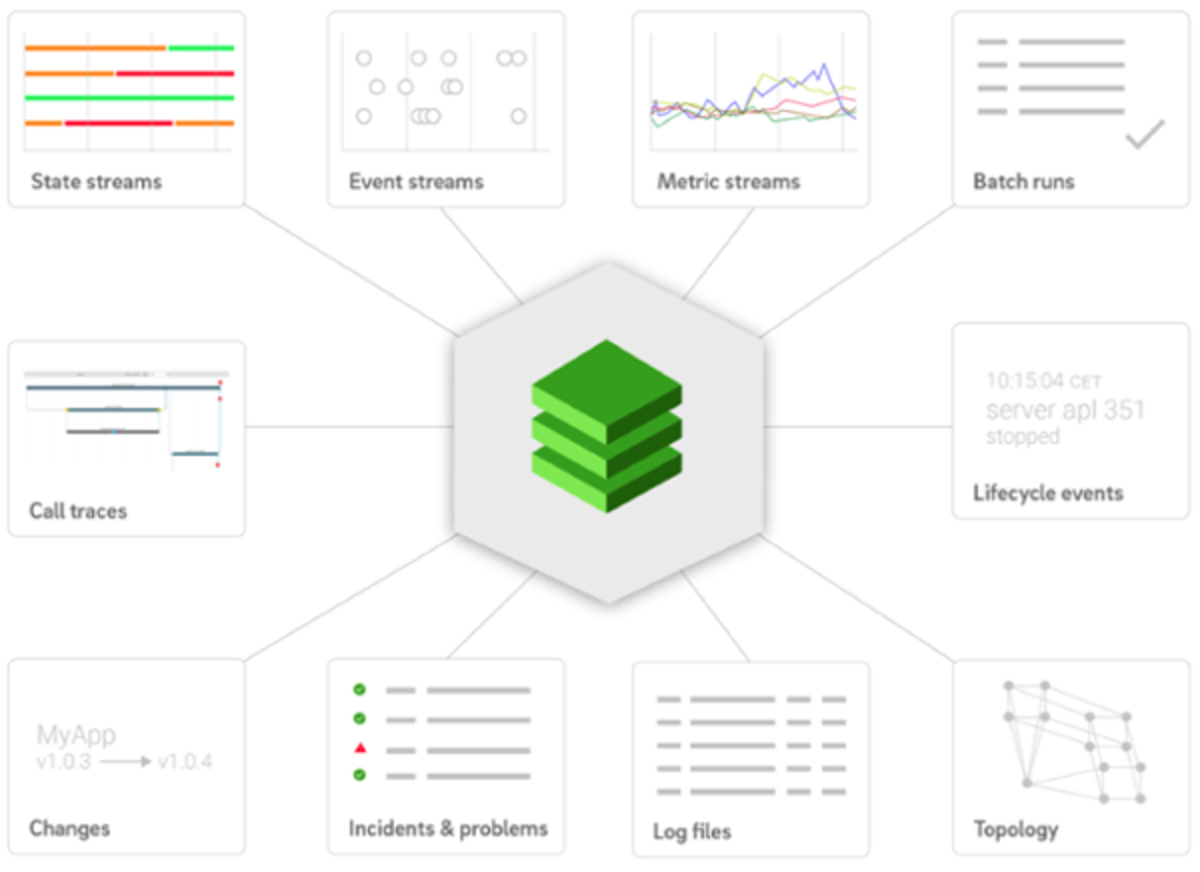
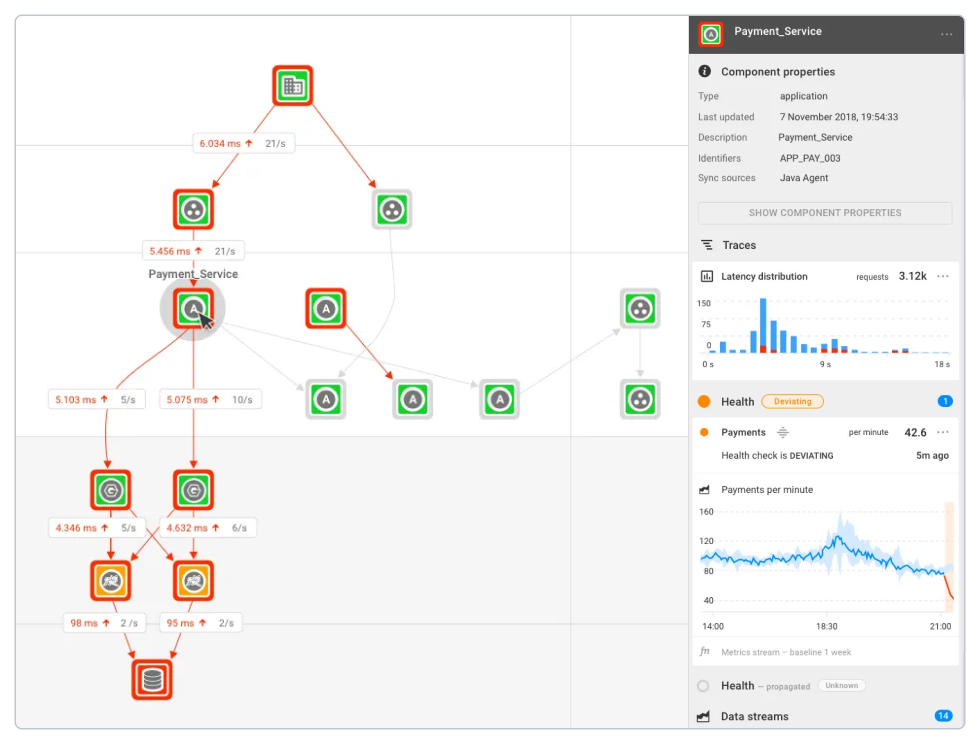
StackState
StackState is a smart observability & AIOps, powered by topology that maps changes to problems in your stack at any point in time so you can become a zero downtime enterprise. StackState’s approach tracks every change in topology and correlates it with system-wide telemetry data in real-time and over time. Moreover, it is purpose-built to integrate quickly with other data sources. It combines siloed telemetry and enriches it with time-series topology data so you can see cause and effect everywhere across your stack.
| Data Lineage: |
|
|---|---|
| Data Monitoring: |
|
| Data Profiling: |
|
| Export: | CSV,FDF,XML |
| Free edition: |
|
| Machine Learning: |
|
| Notifications: |
|
| Schema Change Tracking: |
|

Data observability tools help the company track and understand the state of its data at any given time and provide it with full insight into their data pipelines. They also allow them to identify, monitor and troubleshoot errors in order to minimize data issues and improve high data quality.
By monitoring data across multi-layered IT architecture, data observability tools enable identifying bottlenecks and data issues no matter where they originate. Thanks to new insights into how the data is moving through your IT infrastructure, it's possible to improve identification and resolution of the errors and search for the issues that could potentially be missed.
To help you select the best solution for monitoring the data health in your company, we've prepared a list of data observability tools that will enable your team to understand your data systems to fix and prevent data problems.