 SQL Server
 Oracle
 MySQL
MySQL
 PostgreSQL
 Amazon Redshift
 Azure SQL Database
 DBT
DBT
 Google Big Query
 IBM DB2
 MariaDB
 SAP HANA
 Snowflake
 SQLite
 Teradata
 Vertica
Data observability tools
Data observability tools help the company track and understand the state of its data at any given time and provide it with full insight into their data pipelines. They also allow them to identify, monitor and troubleshoot errors in order to minimize data issues and improve high data quality.
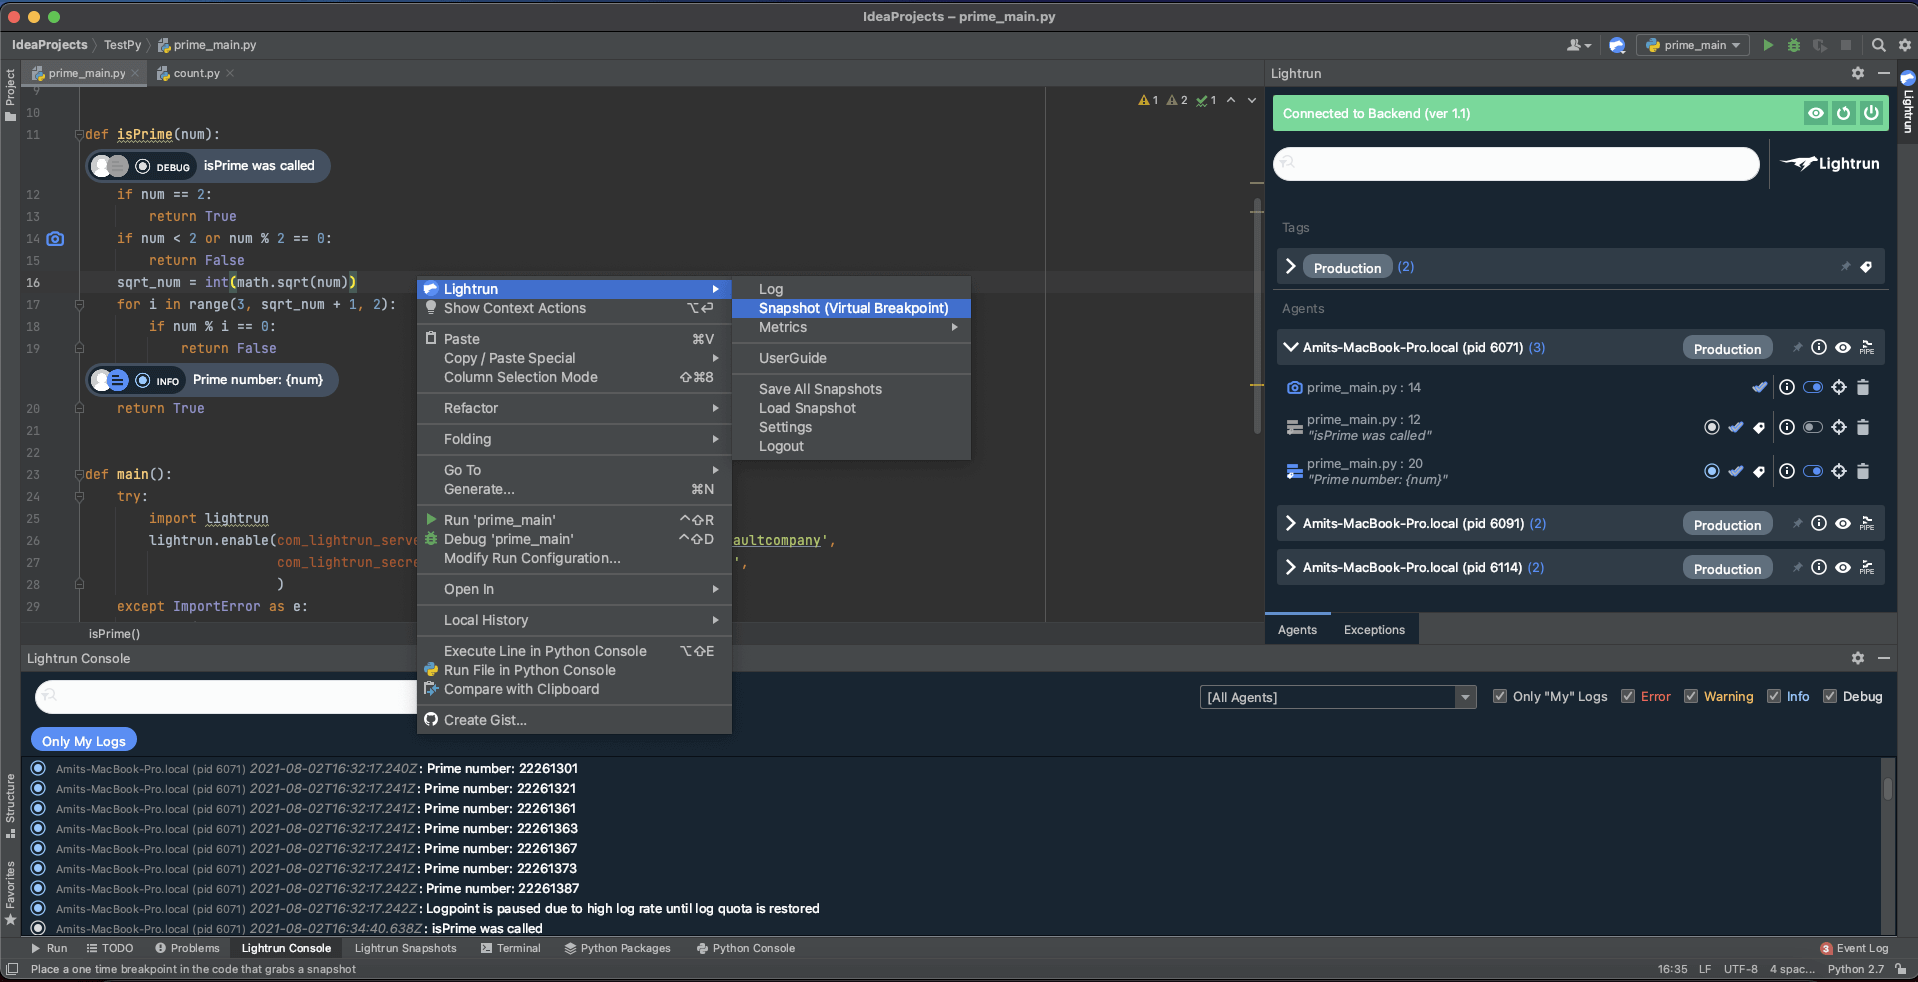
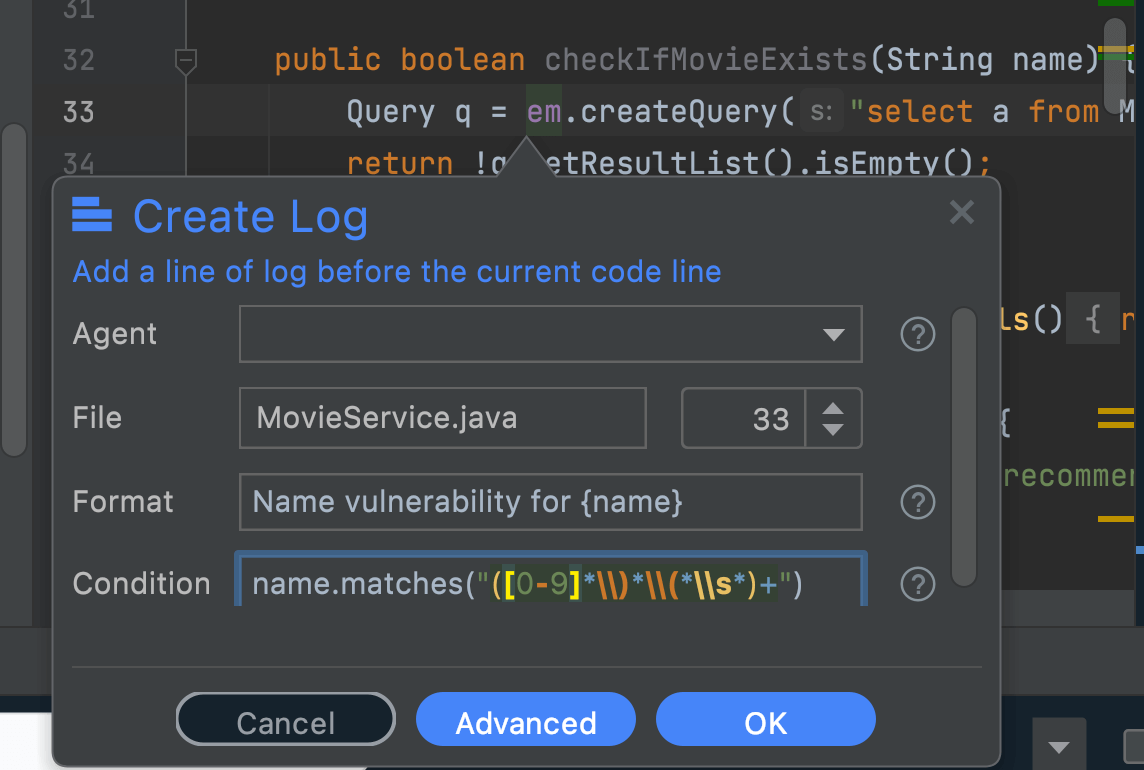
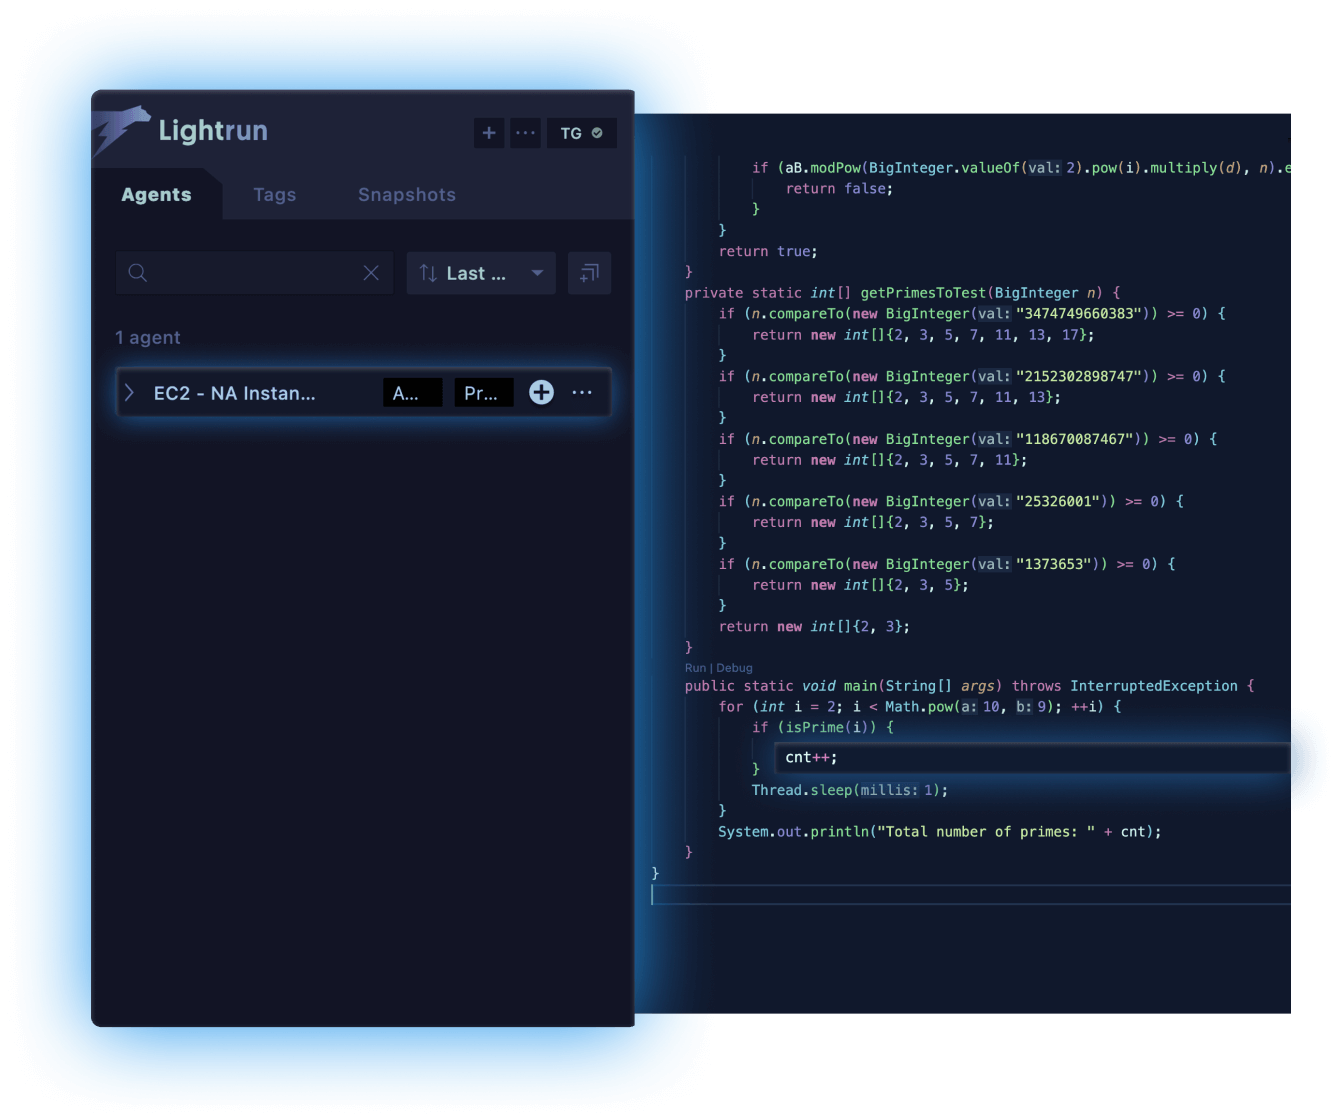
Lightrun
Lightrun is a developer observability tool that dynamically instruments logs, metrics & traces from your IDE in live applications running in QA, CI, or Production. Instead of retroactively analyzing existing telemetry, Lightrun enables developers to add new logs, snapshots, and metrics straight from the IDE without stopping the running application. Overall, it’s a whole new kind of observability, designed from the ground up to work for developers.
| Data Lineage: |
|
|---|---|
| Data Monitoring: |
|
| Data Profiling: |
|
| Export: | CSV,HTML,MS Excel,PDF,RTF,XML |
| Free edition: |
|
| Machine Learning: |
|
| Notifications: |
|
| Schema Change Tracking: |
|
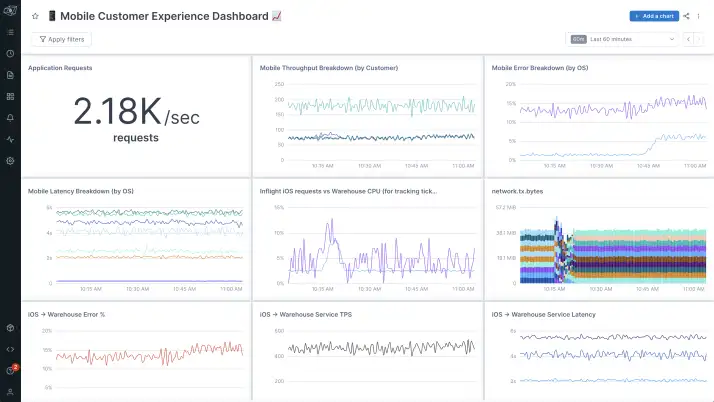
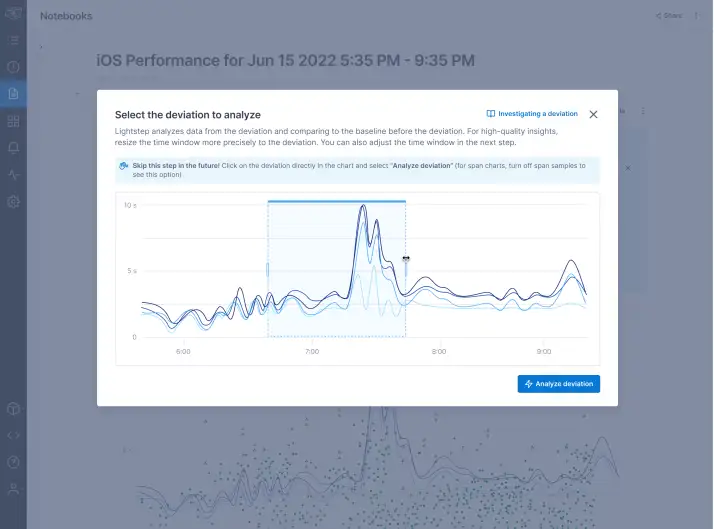
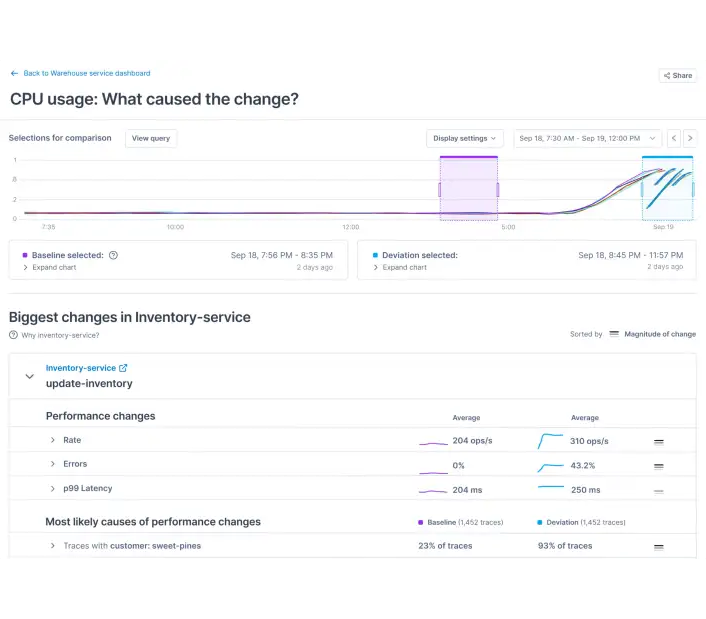
Lightstep
Lightstep is a complete, unified, and primary observability platform for the enterprise that provides complete system visibility and context at scale. It automatically detects changes to your application, infrastructure, and user experience — and surface the specific causes. Moreover, Understand and improve performance across millions of devices, users, and customers. Overall, visualize, aggregate, and analyze planet-scale application and infrastructure metrics at a fraction of the cost
| Data Lineage: |
|
|---|---|
| Data Monitoring: |
|
| Data Profiling: |
|
| Export: | CSV |
| Free edition: |
|
| Machine Learning: |
|
| Notifications: |
|
| Schema Change Tracking: |
|
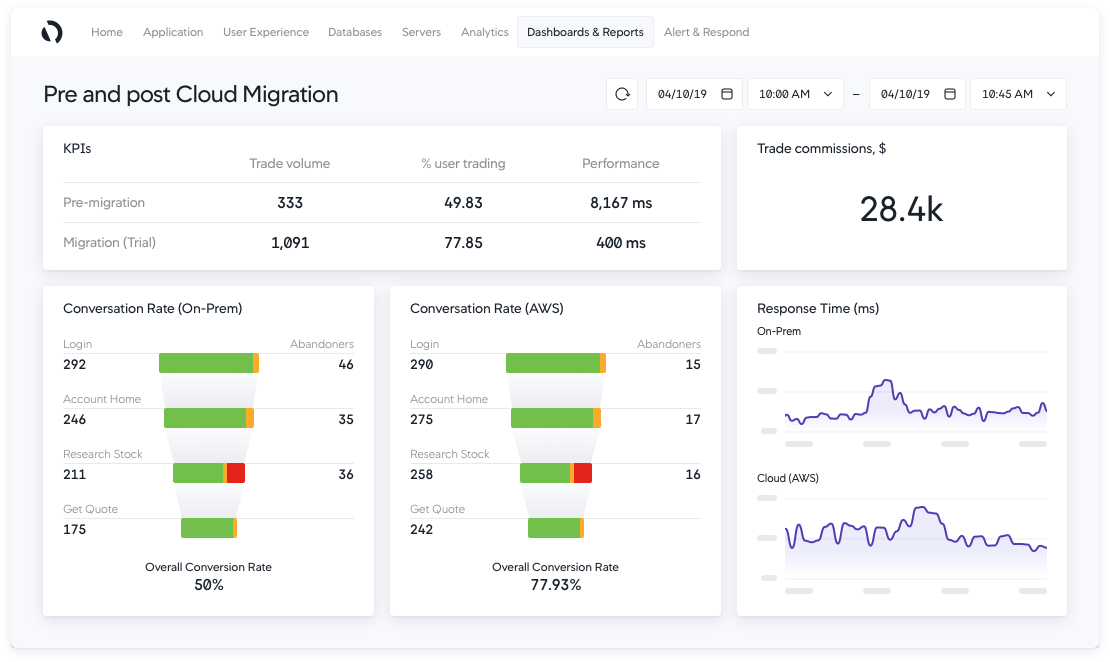
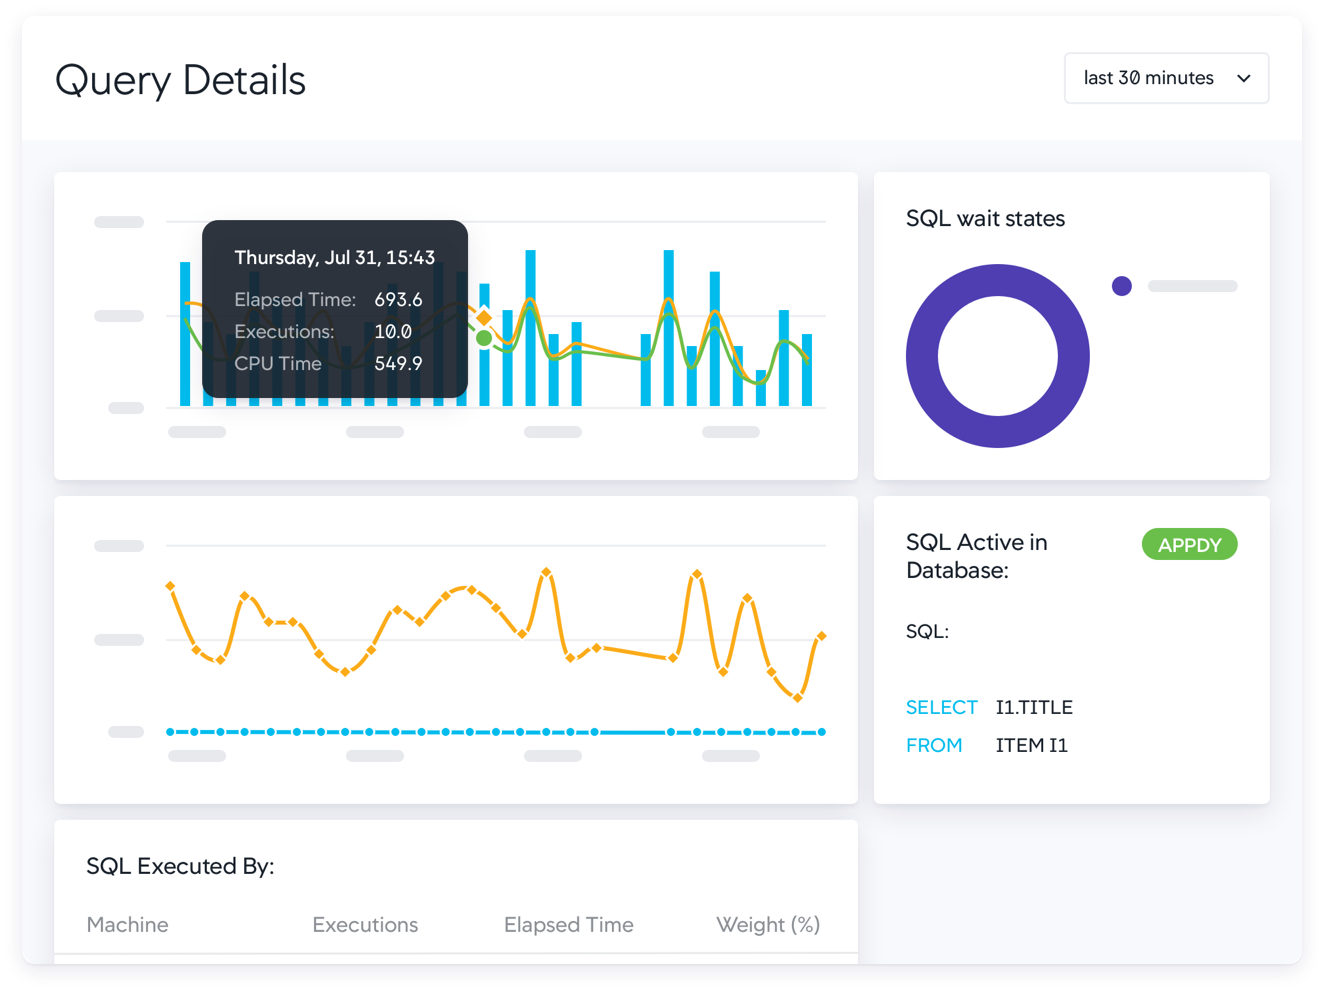
AppDynamics
AppDynamics is a business observability platform that helps you see, understand, and optimize your back-end operations to accelerate your organization’s evolution within today’s digital economy. With AppDynamics you can plan, execute, and quickly address any technical and performance issues with an end-to-end view of every application, hybrid cloud infrastructure element, or network function that your business depends on.
| Data Lineage: |
|
|---|---|
| Data Monitoring: |
|
| Data Profiling: |
|
| Export: | CSV,JSON,PDF |
| Free edition: |
|
| Machine Learning: |
|
| Notifications: |
|
| Schema Change Tracking: |
|
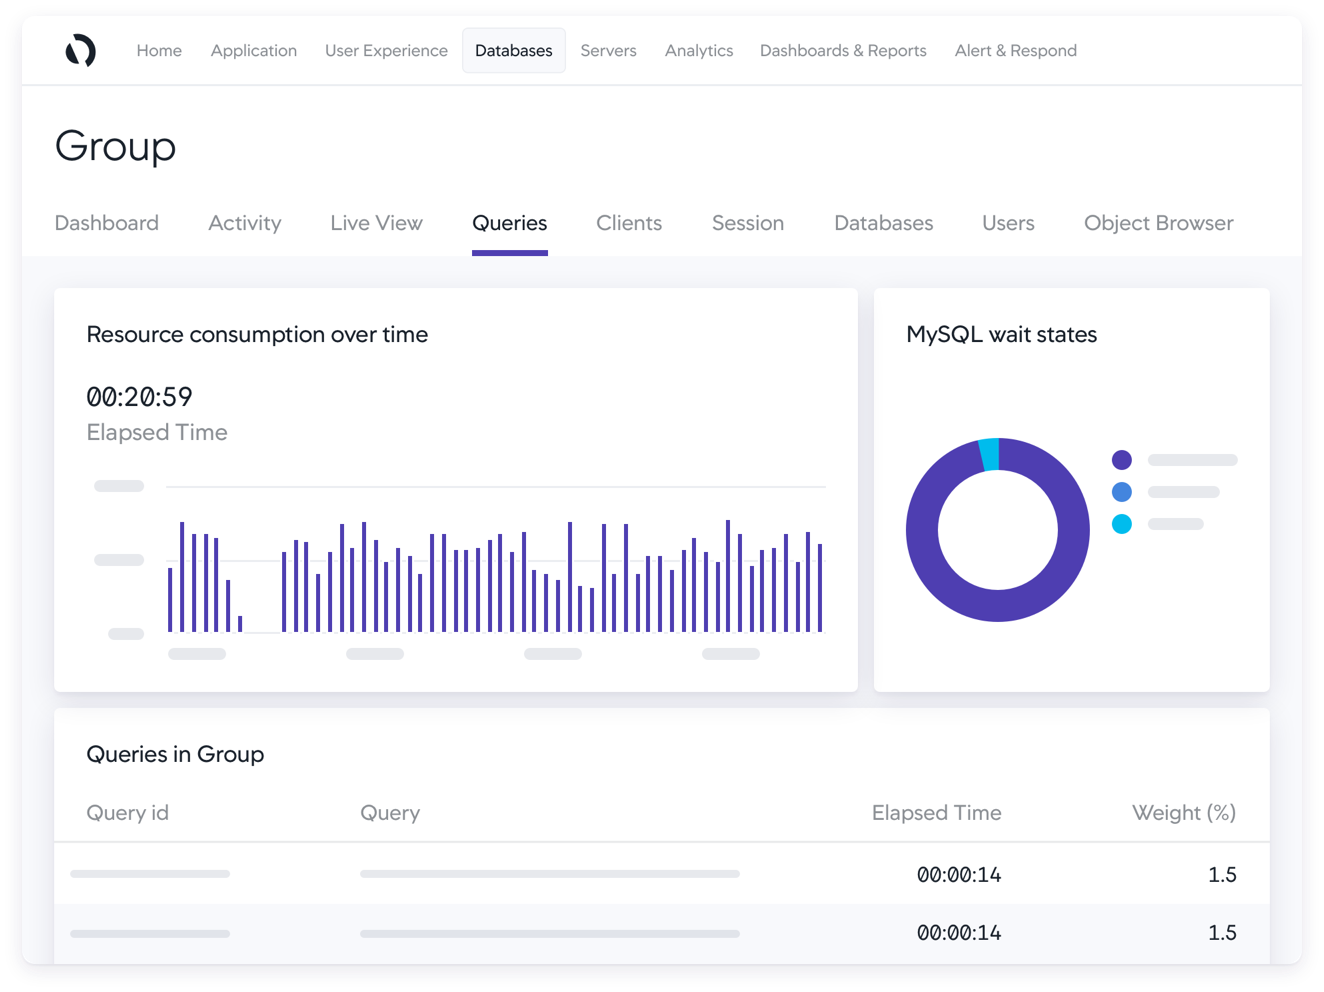
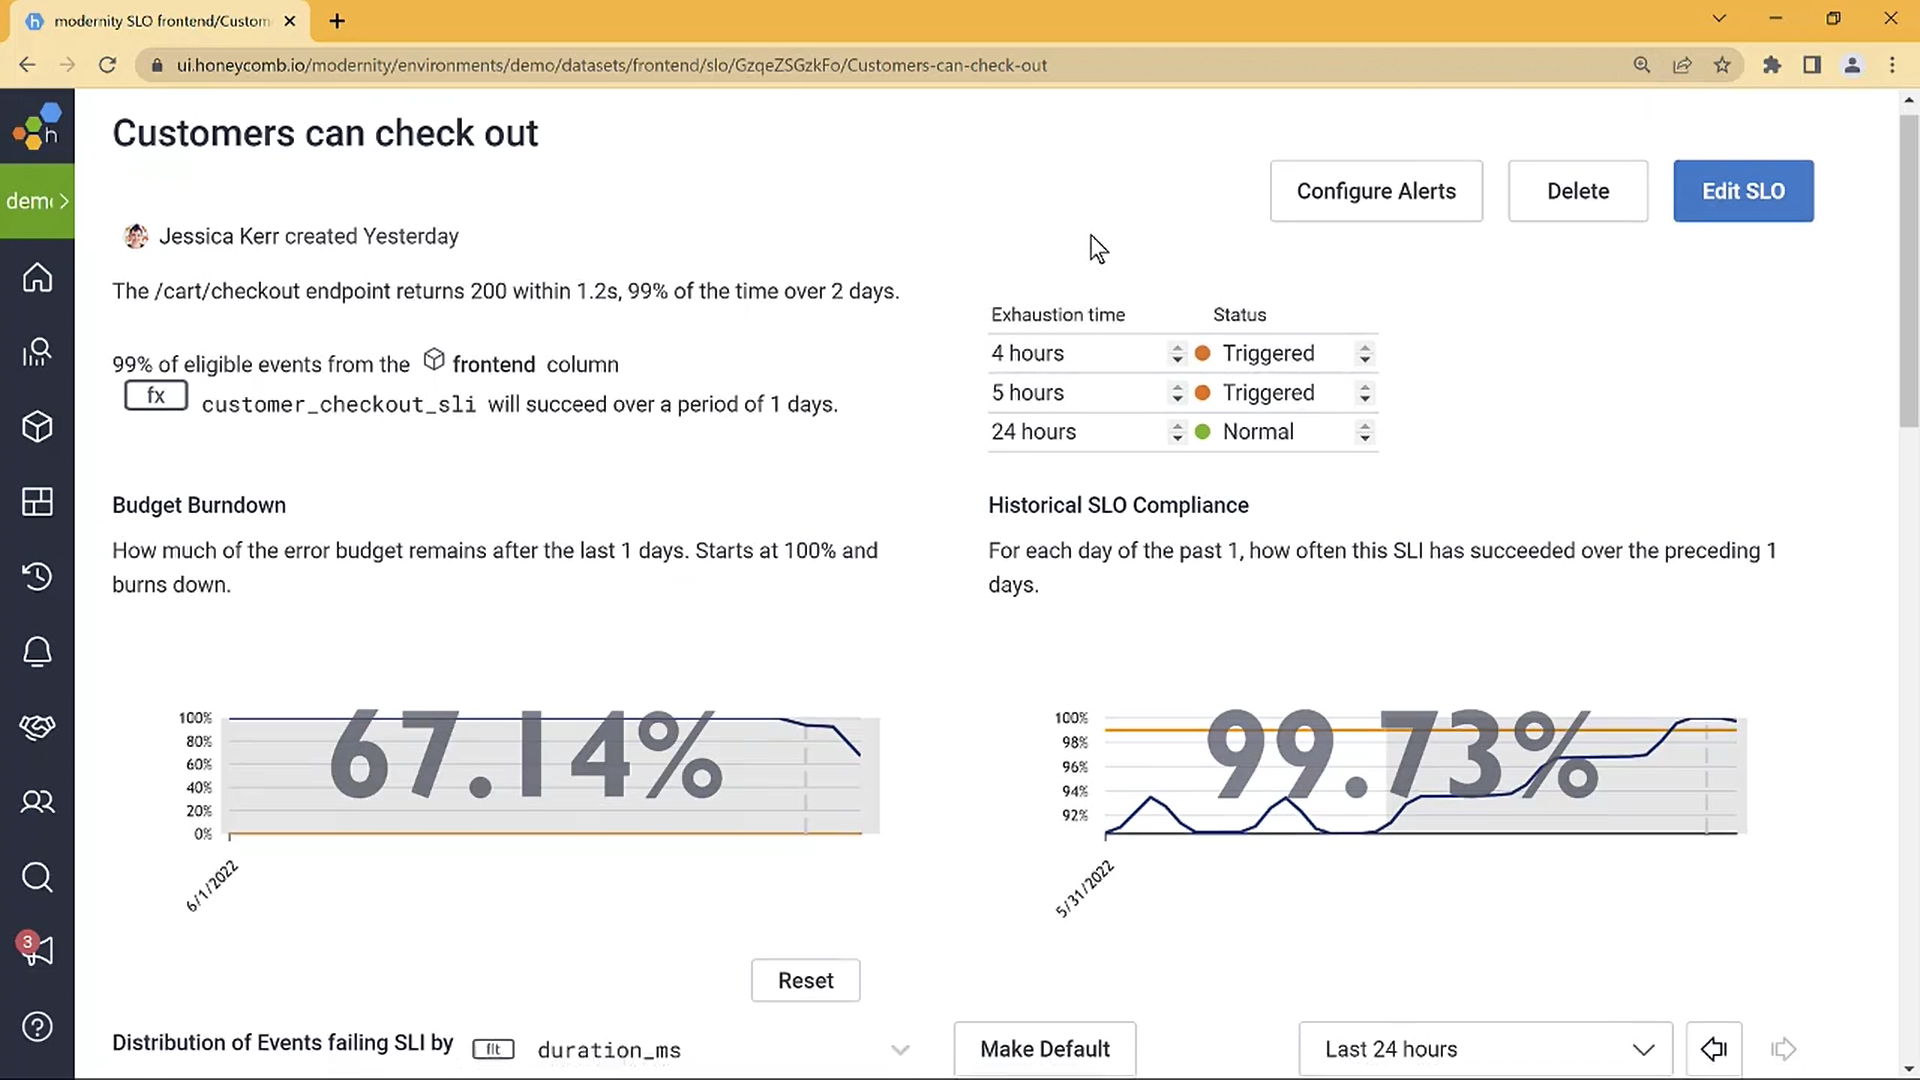
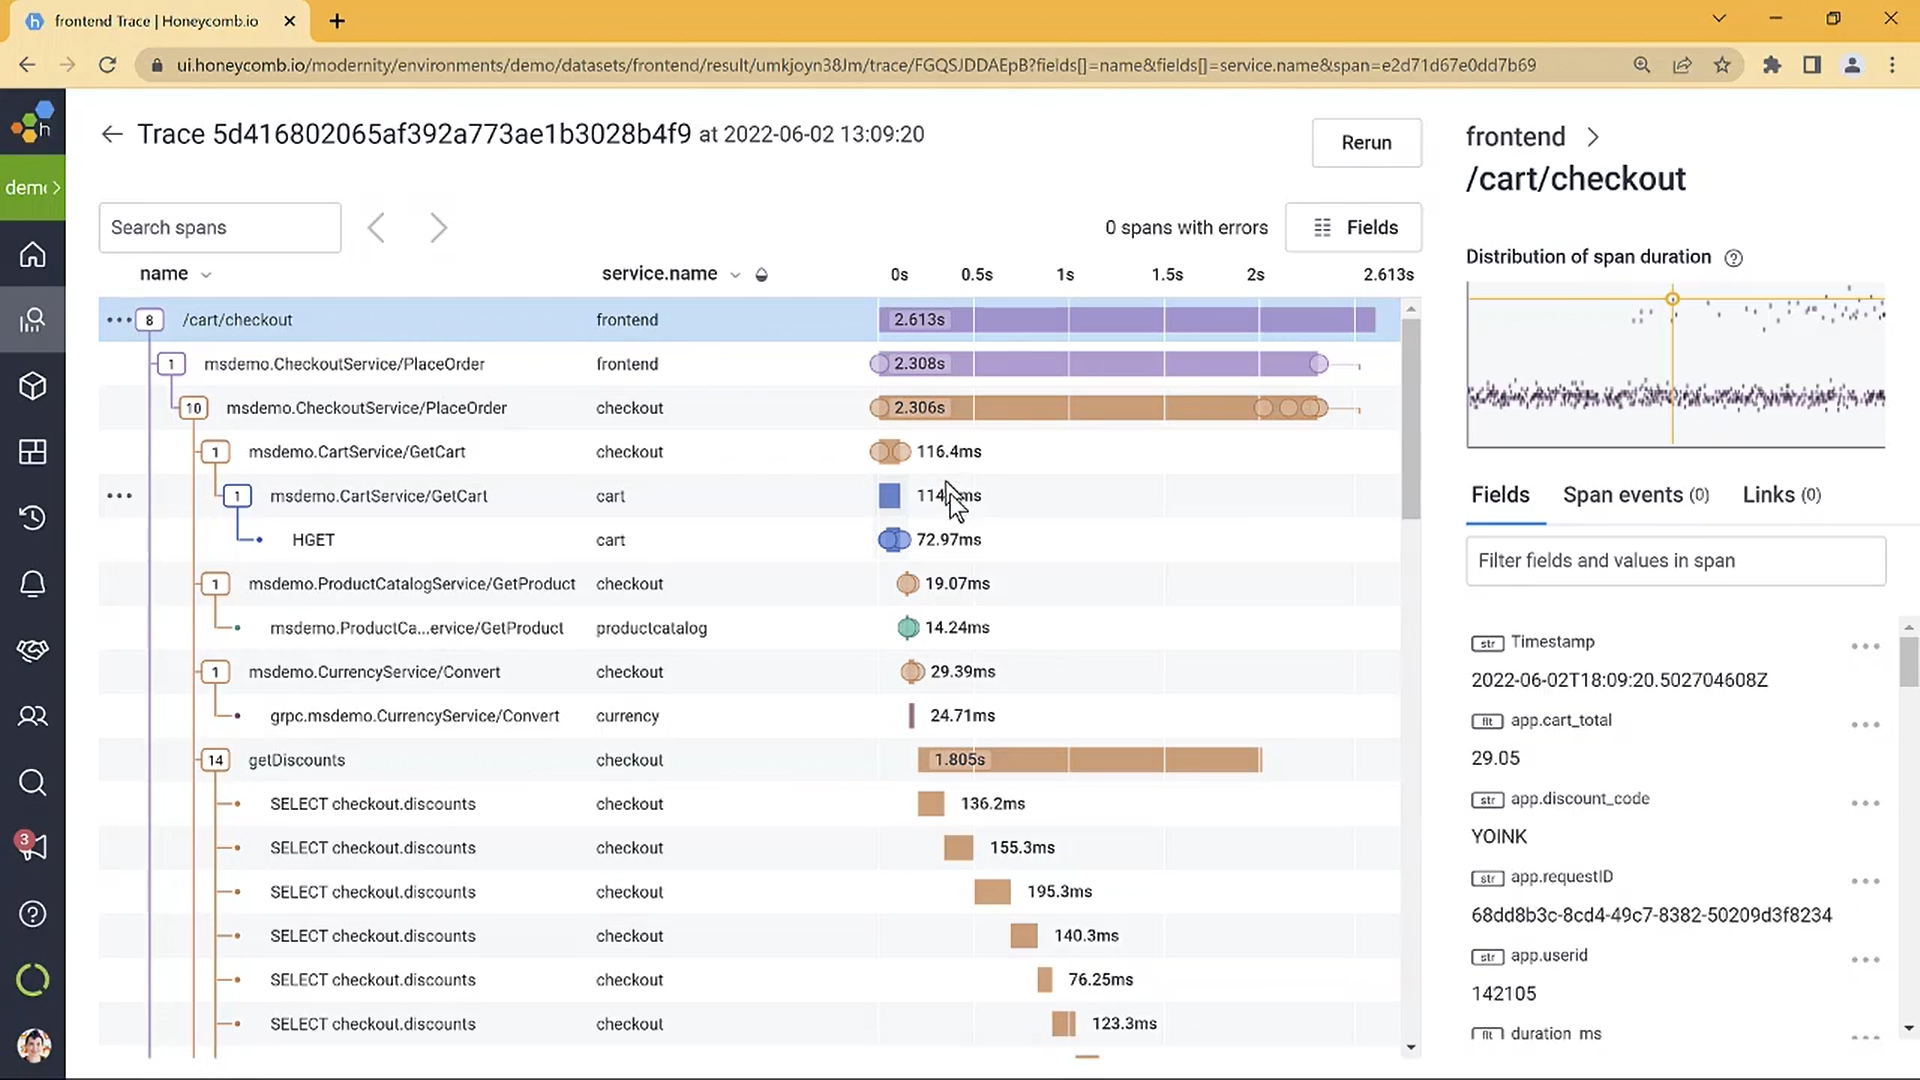
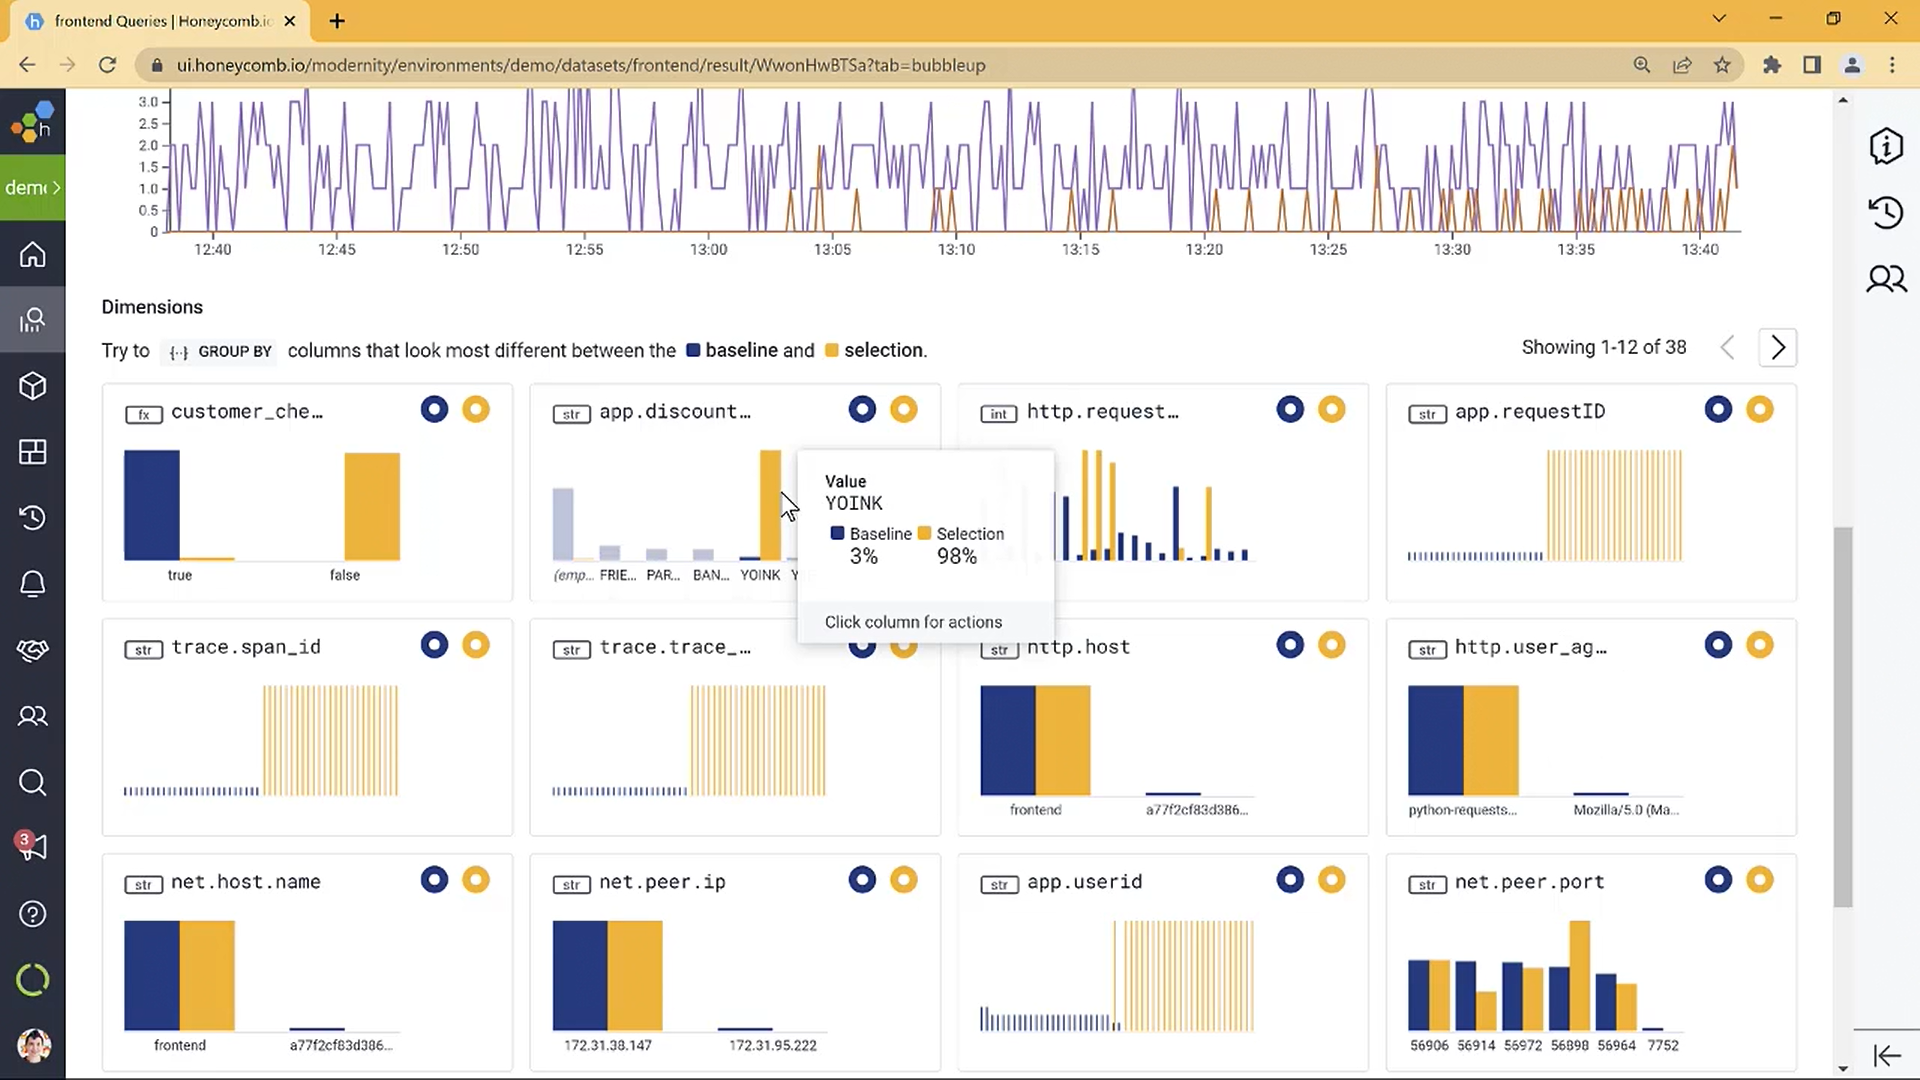
Honeycomb
Honeycomb is a all-in-one observability platform with different set of tools. Honeycomb Metrics brings essential system metrics alongside application observability data to provide a comprehensive view of your application and all of its underlying dependencies for faster debugging and incident resolution. Similarly, Honeycomb works directly with MySQL, MongoDB, or PostgreSQL in order to reliably track down the source(s) of any slowness or odd behavior in just a few clicks.
| Data Lineage: |
|
|---|---|
| Data Monitoring: |
|
| Data Profiling: |
|
| Export: | CSV,JSON |
| Free edition: |
|
| Machine Learning: |
|
| Notifications: |
|
| Schema Change Tracking: |
|
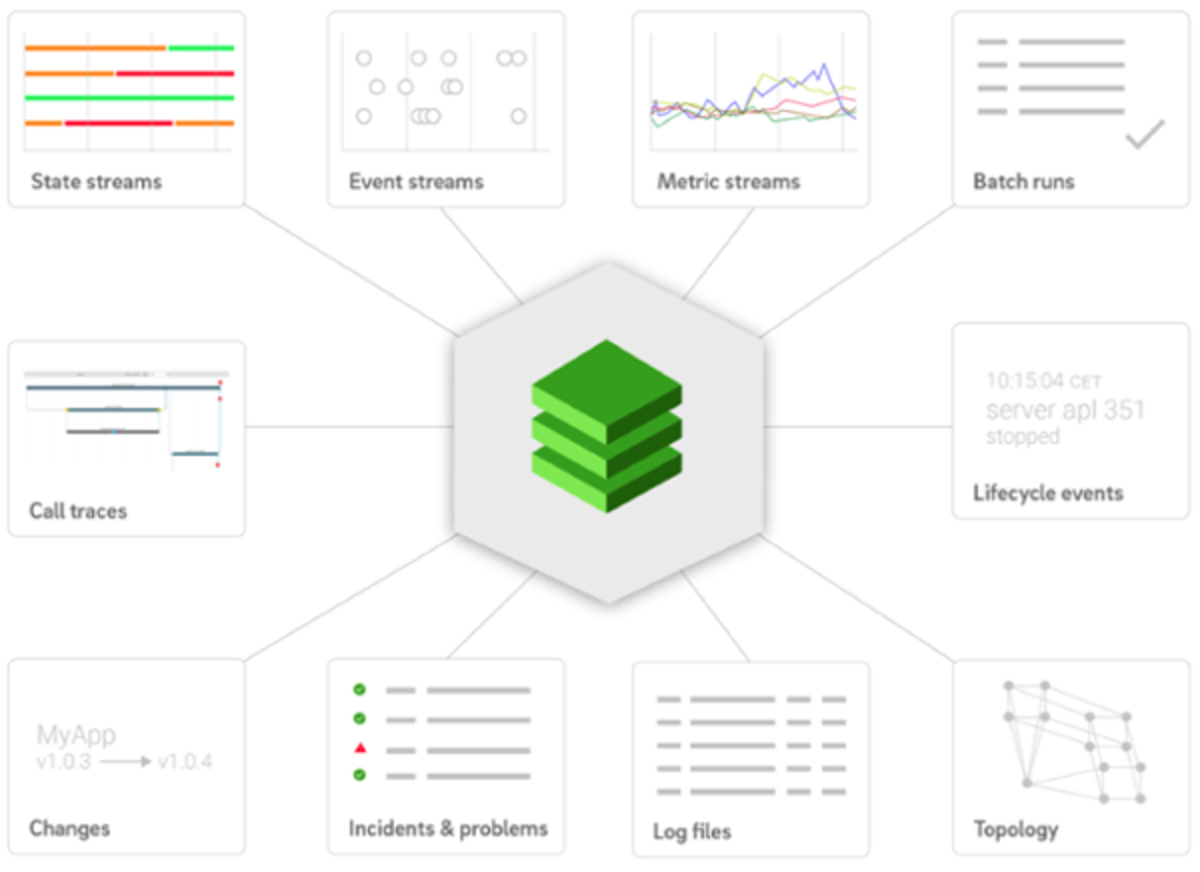
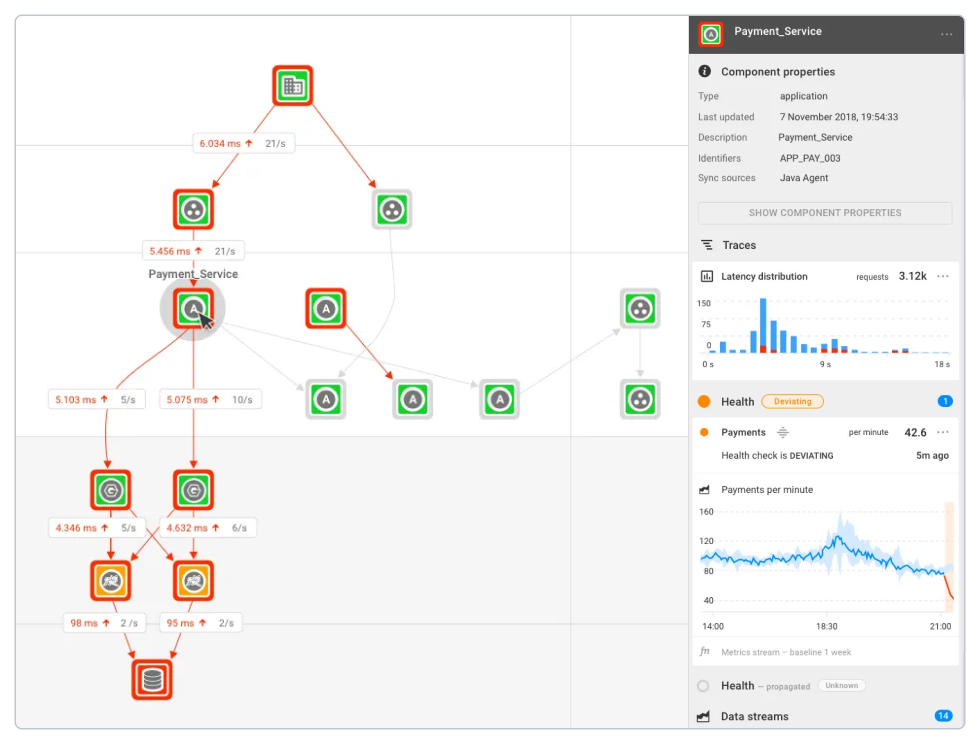
StackState
StackState is a smart observability & AIOps, powered by topology that maps changes to problems in your stack at any point in time so you can become a zero downtime enterprise. StackState’s approach tracks every change in topology and correlates it with system-wide telemetry data in real-time and over time. Moreover, it is purpose-built to integrate quickly with other data sources. It combines siloed telemetry and enriches it with time-series topology data so you can see cause and effect everywhere across your stack.
| Data Lineage: |
|
|---|---|
| Data Monitoring: |
|
| Data Profiling: |
|
| Export: | CSV,FDF,XML |
| Free edition: |
|
| Machine Learning: |
|
| Notifications: |
|
| Schema Change Tracking: |
|

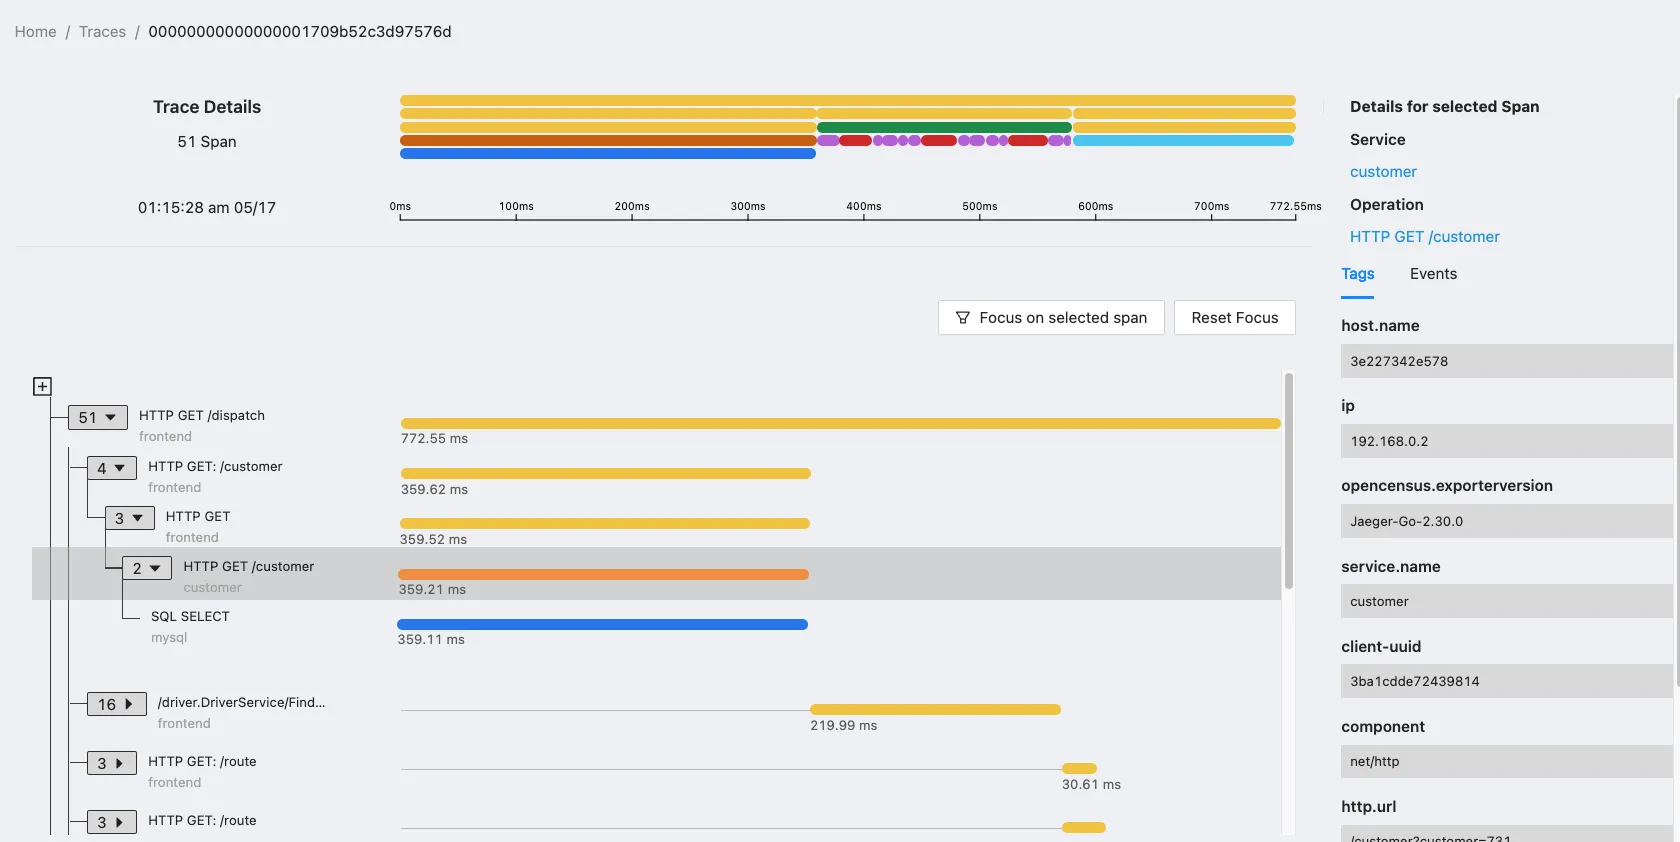
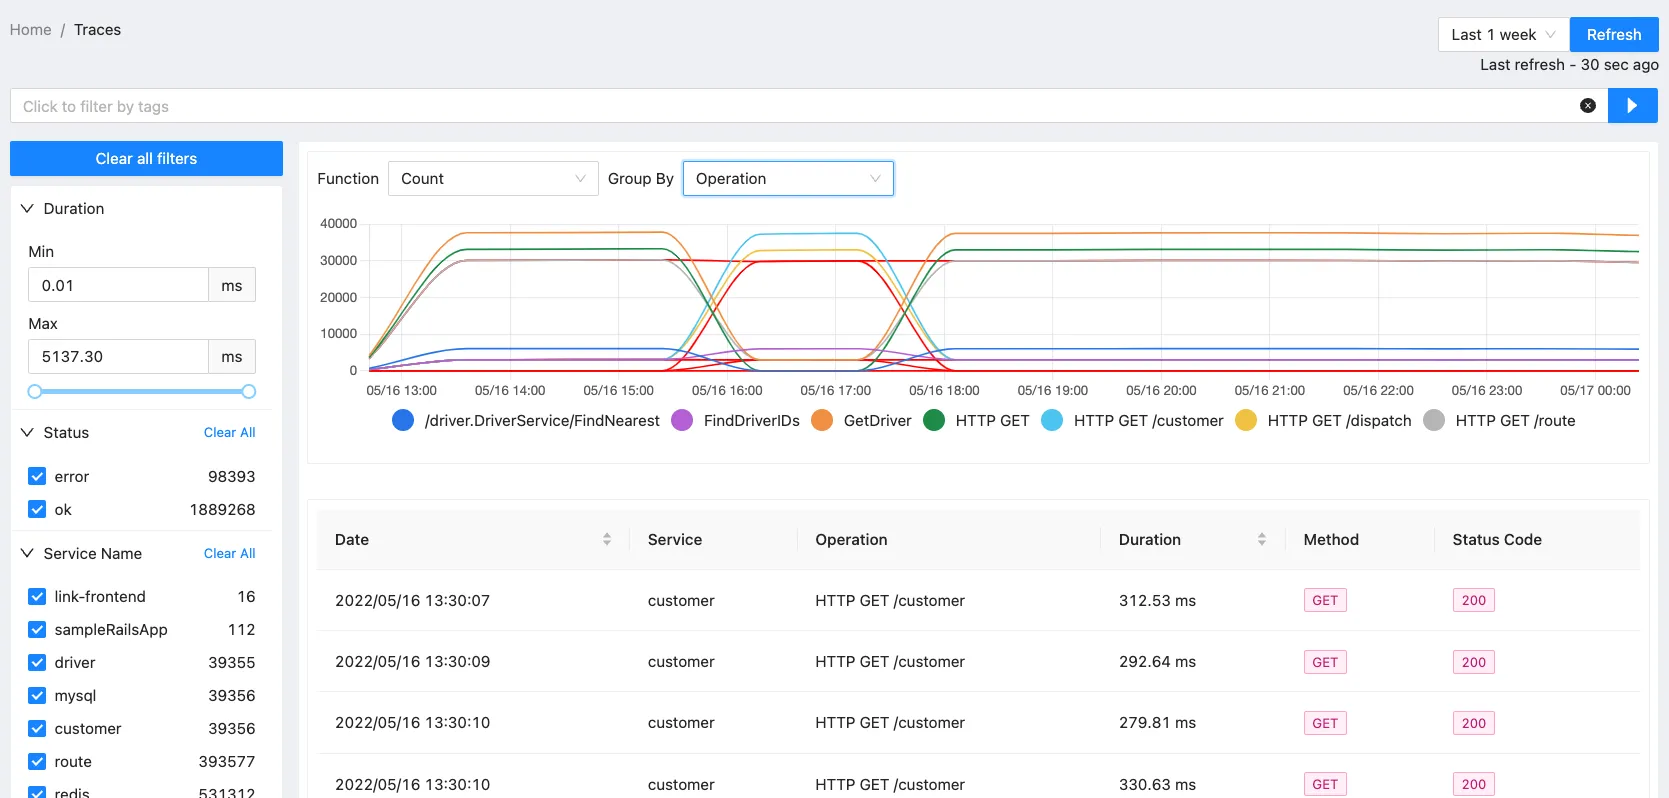
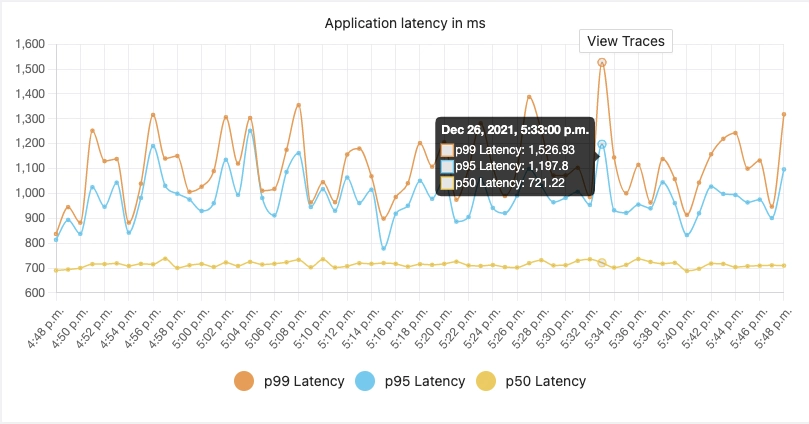
SigNoz
SigNoz is an open-source data observability and application performance monitoring tool that helps you monitor your applications and troubleshoot problems. It provides a single pane for metrics, traces and logs. Moreover, it offers advanced traces filtering to drill down into interesting traces.
| Data Lineage: |
|
|---|---|
| Data Monitoring: |
|
| Data Profiling: |
|
| Export: | - |
| Free edition: |
|
| Machine Learning: |
|
| Notifications: |
|
| Schema Change Tracking: |
|
Data observability tools help the company track and understand the state of its data at any given time and provide it with full insight into their data pipelines. They also allow them to identify, monitor and troubleshoot errors in order to minimize data issues and improve high data quality.
By monitoring data across multi-layered IT architecture, data observability tools enable identifying bottlenecks and data issues no matter where they originate. Thanks to new insights into how the data is moving through your IT infrastructure, it's possible to improve identification and resolution of the errors and search for the issues that could potentially be missed.
To help you select the best solution for monitoring the data health in your company, we've prepared a list of data observability tools that will enable your team to understand your data systems to fix and prevent data problems.